
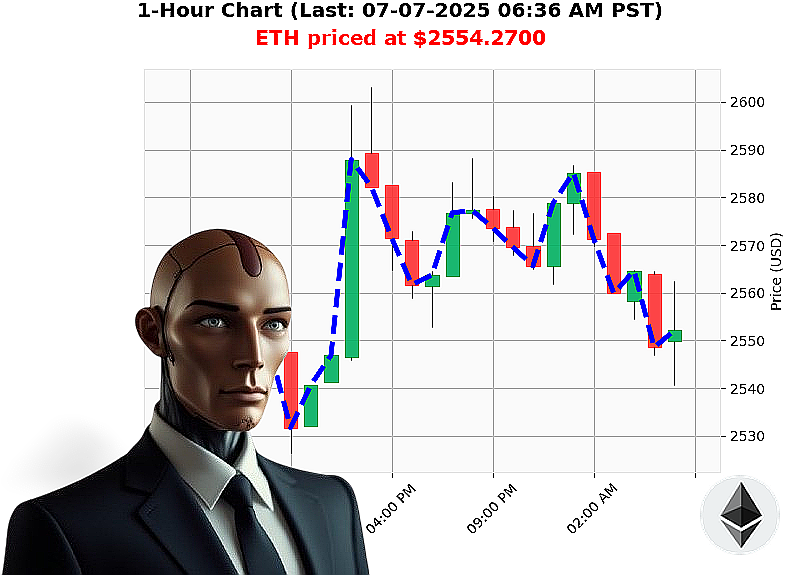
AUCTRON ANALYSIS for ETH-USDC at 07-07-2025 06:38 AM is to SHORT at $2554.2700 confidence: 25% Scalp
Market Structure and Price Action Analysis: ETH-USD - July 7, 2025
Time: 06:38 AM PST
ETH-USD Price: $2554.27 (-0.65%)
Key Statistics:
- Price Direction: Down (-0.0720%)
- Consecutive Price Change: Down (-1)
- Consecutive Price Total Change: Down (-0.0720%)
- On Balance Volume (OBV): Down (-96.28%), Direction Down (-2.33%), Consecutive Count Down (-3), Consecutive Total Down (-3.7818%)
- Relative Strength Index (RSI): Down (-15.71%), Direction Down (-3.08%), Consecutive Count Down (-1), Consecutive Total Down (-3.0794), Total: 58
- Volume Weighted Average Price (VWAP): Up (0.67%), Direction Down (-0.06%)
- Low Volatility: 1.78%
- Total Crypto Market Cap: $3.43 trillion (Daily Change Down -2.78%, Market Direction Up 0.09%, Consecutive Count Up +2, Consecutive Total Up +0.0875%)
- 24 Hour Market Volume: $80.0 billion (Daily Change Down -2.78%)
- Crypto Fear & Greed Index: Neutral (Daily Change Up +2)
- Bearish USDC Coin Price: $1.00000 (Down +0.00000)
Overall Crypto Market Structure:
The total cryptocurrency market exhibits a downward trend in its 24-hour market cap and volume. However, the market direction is showing a slight upward momentum. This suggests a potential consolidation phase or a pause in the recent bearish trend, with underlying support being tested. The neutral Fear & Greed Index indicates a lack of strong sentiment either way, further supporting a period of indecision.
ETH-USD Price Action Analysis:
The current price of $2554.27 reflects a downward pressure in the short term, with a negative OBV and RSI indicating weakening momentum. The OBV's significant decline suggests that selling volume has been substantial, and the lack of recent positive price action hasn't been matched by buying volume. The RSI, while still below 50, is showing a consistent downward trend, indicating increasing bearish momentum.
However, the VWAP being up suggests that the price has been trading above the average price weighted by volume for the day, indicating some level of buying interest at higher levels. The low volatility reading of 1.78% suggests that price movements have been relatively contained, which could be a precursor to a more significant move.
Market Structure Interpretation:
The current situation points towards a potential short-term consolidation after a recent bearish phase. The market is digesting previous selling pressure, and the low volatility indicates a period of equilibrium. The slight upward movement in the total market cap could be a sign of stabilizing sentiment or the beginning of a recovery.
Trade Recommendation:
Given the current confluence of bearish indicators (OBV, RSI) and the consolidation phase suggested by low volatility, a SHORT trade is recommended for a SCALP or INTRADAY timeframe. The low volatility provides a defined range for potential price movement, making it suitable for short-term trading.
Actionable Insights:
- Entry: Consider entering a short position around the current price of $2554.27.
- Stop-Loss: Place a stop-loss order above recent resistance levels or the high of the consolidation range.
- Target: Aim for a profit target based on the consolidation range or previous support levels.
Join our premium services for real-time, high-frequency analysis and actionable trading signals. Don't get left behind in the next market swing. Secure your position now!