
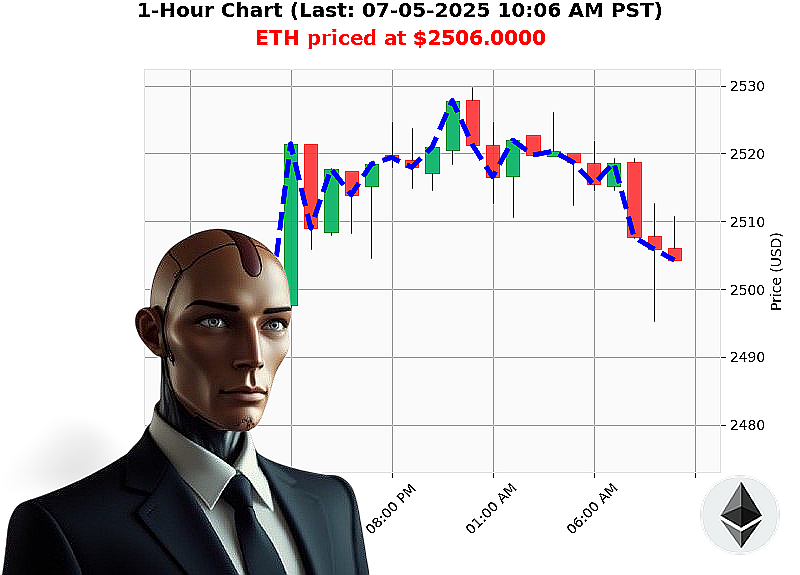
AUCTRON ANALYSIS for ETH-USDC at 07-05-2025 10:08 AM is to SHORT at $2506.0000 confidence: 75% Intraday
Market Structure and Price Action Analysis: ETH-USD - 07-05-2025 10:08 AM PST
Executive Summary: The ETH-USD pair is currently exhibiting significant bearish momentum across multiple indicators, coupled with a broader downturn in the overall cryptocurrency market. While the market cap shows a marginal daily increase, the volume and price action data paint a concerning picture. This analysis suggests a high probability of continued downward pressure in the short term.
Step 1: Current Price & Momentum Assessment (ETH-USD)
- Current Price: $2506.00
- Price Direction: Down -0.1080%
- Consecutive Price Total Down: -0.1080%
- On Balance Volume (OBV): Down -35.08% (OBV Direction: Down -24.16%, Consecutive Count Down -1, Consecutive Total Down -24.1565%) - This indicates a strong outflow of buying pressure.
- Whale Exit Crossover: DOWN
- Price Action Crossover: DOWN
- Relative Strength Index (RSI): Down -10.89% (RSI Direction: Down -1.13%, Consecutive Count Down -1, Consecutive Total Down -1.1283) - RSI is deeply oversold, but the downward trend persists.
- Volume Weighted Average Price (VWAP): Down -1.32% (VWAP Direction: Down -0.11%) - Reinforces the downward trend across trading volume.
- Low Volatility: 1.30% - While low volatility can sometimes precede significant moves, in the current context, it suggests a concentrated period of selling.
Step 2: Overall Crypto Market Structure (07-05-2025 10:08 AM PST)
- Total Crypto Market Cap: $3.40 trillion (Daily Change Down -2.68%, Consecutive Count Up +2, Consecutive Total Up +0.2463%) - Despite a daily decrease, the overall market cap has shown a recent upward trend. However, the current decline is notable.
- 24 Hour Market Volume: $54.0 billion (Daily Change Down -2.68%) - Significant volume outflow accompanies the price decline.
- Market Direction: Up 0.25% - This appears contradictory to the current price action, potentially indicating a short-term bounce or a lagging indicator.
- Crypto Fear & Greed Index: Neutral at 51 (Down Daily -4) - Suggests a lack of strong sentiment, neither overwhelmingly bullish nor bearish, but the recent decline indicates a shift towards caution.
- Bullish USDC Coin Price: $1.00028 (Down +0.00000) - The USDC coin's price movement is negligible and doesn't provide significant directional insight for ETH-USD.
Step 3: Synthesis and Interpretation
The data strongly indicates a prevailing bearish sentiment for ETH-USD. The consistent downward movement across price, volume, OBV, RSI, and VWAP suggests a sustained sell-off. While the overall market cap has seen recent gains, the current volume and price decline are significant. The neutral Fear & Greed Index doesn't offer a counter-narrative. The low volatility could be a temporary pause before further price action.
Market Structure: The current structure appears to be in a downtrend, with no clear signs of immediate reversal. The recent price action crossovers and whale exit further support this bearish outlook.
Step 4: Trade Recommendation
Given the overwhelming bearish signals across multiple timeframes and indicators, and the current low volatility, a SHORT trade is recommended for a SCALP or INTRADAY strategy. The low volatility presents a potential opportunity for a quick profit on a downward move.
Call to Action:
Are you ready to capitalize on these high-confidence market insights' Join our premium services for real-time analysis, actionable trading signals, and a competitive edge in the dynamic cryptocurrency market. Don't miss out on the opportunity to profit from the current bearish trend in ETH-USD.
Hashtags: