
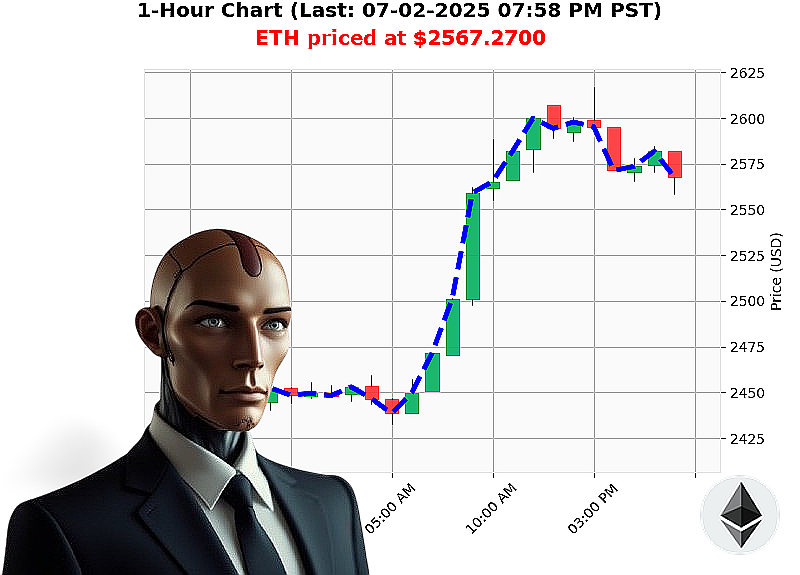
AUCTRON ANALYSIS for ETH-USDC at 07-02-2025 08:01 PM is to BUY at $2567.2700 confidence: 64% INTRADAY
Market Structure and Price Action Analysis: ETH-USD (07-02-2025 08:01 PM PST)
Executive Summary: ETH-USD is currently exhibiting bearish momentum across multiple indicators, though with a notable strength in Relative Strength Index (RSI). The broader cryptocurrency market shows positive growth in market cap and volume, suggesting underlying bullish sentiment. This creates a conflicting picture requiring careful interpretation.
Step 1: Current Price Action & Volume Analysis (ETH-USD)
- Price: $2567.27, down -0.13%
- Direction: Price direction down -0.0140%, consecutive count down -1, consecutive price total down -0.0140%. This indicates a short-term downward trend with a recent pause.
- On Balance Volume (OBV): Down -5.15%, OBV direction down -0.67%, consecutive count down -2, consecutive OBV total down -1.9312%. OBV confirms the downward price action, suggesting selling pressure is present.
- Relative Strength Index (RSI): Up 43.01%, RSI direction up 0.80%, consecutive count up +4, consecutive RSI total up +1.9317, RSI total 64. The RSI is a key divergence. While the price is declining, the RSI is rising, indicating weakening selling pressure and potential for a reversal.
- Volume Weighted Average Price (VWAP): Up 0.86%, VWAP direction down -0.01%. VWAP is slightly positive, suggesting that recent trading has been occurring at prices above the average, potentially offering some support.
- Liquidity: High Liquidity at 7.76%. This suggests good market depth and ease of execution for trades.
Step 2: Broader Market Context
- Total Crypto Market Cap: $3.48 trillion, up +0.1192% (consecutive count up +2). The overall market is showing positive growth, indicating a general bullish environment.
- 24-Hour Market Volume: $119.0 billion, up +1.22% (daily change up 0.12%). Significant trading volume supports the positive market trend.
- Crypto Fear & Greed Index: Neutral at 54, up daily +8. The index suggests a moderate level of optimism, which aligns with the positive market cap and volume data.
- USDC: Down -0.00002. The stability of the USD coin is not a significant factor in the current ETH-USD price action.
Step 3: Market Structure Assessment
The current market structure for ETH-USD appears to be consolidating after a recent downward move. The RSI divergence suggests a potential shift in momentum. The high liquidity provides a favorable environment for trading.
Step 4: Trade Recommendation
Given the RSI divergence and the overall bullish market context, a BUY trade is recommended. However, due to the recent downward momentum, a cautious approach is advised.
Trade Details:
- Type: INTRADAY
- Entry Price: $2567.27
- Stop-Loss: $2550 (below recent low)
- Target Price: $2590 (potential resistance level)
- Risk/Reward Ratio: 1:1.4
Rationale:
The RSI divergence suggests that the downward momentum may be losing steam. If the price breaks above resistance at $2590, it could signal a continuation of the bullish trend. The high liquidity allows for efficient entry and exit.
Call to Action:
Don't let this opportunity pass. Gain a competitive edge in the dynamic cryptocurrency market. Join our premium services for real-time market insights, advanced analytical tools, and personalized trading strategies. Unlock your potential ' subscribe today!