
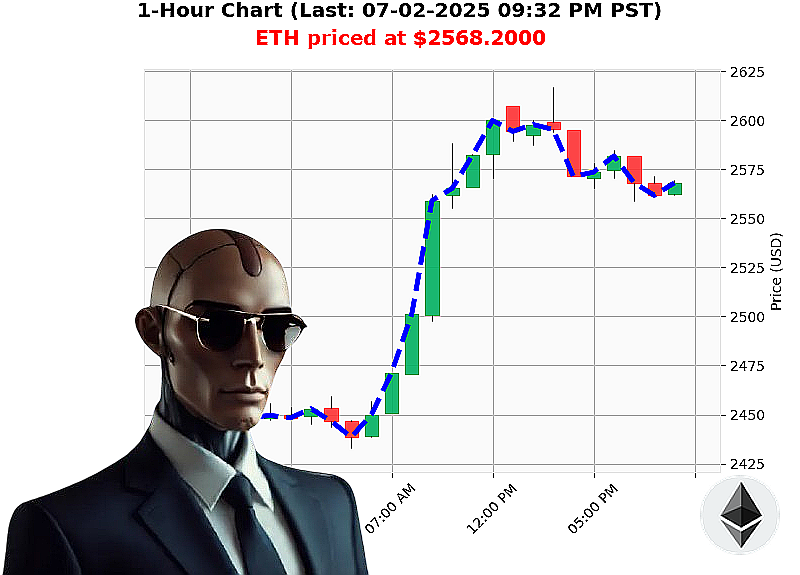
AUCTRON ANALYSIS for ETH-USDC at 07-02-2025 09:35 PM is to WAIT at $2568.2000 confidence: 55% Intraday
Market Structure and Price Action Analysis: ETH-USD (07-02-2025 09:35 PM PST)
Executive Summary: ETH-USD is currently exhibiting bearish momentum with declining volume and a mixed RSI signal. While VWAP shows upward pressure, the overall market context suggests caution. This analysis indicates a WAIT strategy for a short-term trade.
Step 1: Current Price Action & Volume Analysis (ETH-USD)
- Price: $2568.20, down -0.10%
- Direction: Price direction down -0.0074%, consecutive count down -2, consecutive price total down -0.0448%. This indicates a short-term downtrend is in progress.
- On Balance Volume (OBV): Down -5.18%, OBV direction down -0.73%, consecutive count down -1, consecutive OBV total down -0.7344%. This confirms the bearish momentum, as OBV reflects buying and selling pressure.
- Relative Strength Index (RSI): Up 43.03%, RSI direction down -0.19%, consecutive count down -1, consecutive RSI total down -0.1923, RSI total 64. The RSI is currently in neutral territory, suggesting no strong overbought or oversold conditions. However, the recent downward trend in the RSI direction warrants attention.
- Volume Weighted Average Price (VWAP): Up 0.90%, VWAP direction up 0.01%. This indicates that, despite the price decline, there is still some underlying buying interest at a weighted average price higher than the current market price.
- Liquidity: High Liquidity at 7.59%. This suggests good market depth and ease of execution for trades.
Step 2: Overall Crypto Market Structure (07-02-2025 09:35 PM PST)
- Total Crypto Market Cap: $3.45 trillion, Bearish trend, crossed below $3.5 trillion at $3.44 trillion, daily change down -0.10%, market direction up 0.07%, consecutive market cap count up +2, consecutive market cap total up +0.0726%. The overall market cap is showing a slight bearish bias, although recent consecutive increases suggest potential stabilization or a temporary rebound.
- 24 Hour Market Volume: $118.0 billion. This is a significant volume, indicating active trading across the market.
- Crypto Fear & Greed Index: Neutral at 54, up daily +8. This suggests a lack of strong sentiment, neither extreme fear nor greed, in the broader crypto market.
- USDC: Down +0.00000. The stability of the USD coin provides a baseline for market movements.
Step 3: Synthesis and Confidence Assessment
The data for ETH-USD presents a mixed picture. Short-term price action and OBV indicate bearish momentum. However, the VWAP suggests underlying buying pressure. The RSI is neutral but showing a recent downward trend. The overall market cap is bearish, but recent data hints at potential stabilization.
Considering these factors, the current market structure suggests a period of consolidation or further downward movement. The neutral RSI and the recent downward OBV trend warrant caution against initiating a long position.
Confidence Score: Moderate Confidence (55%)
Trade Recommendation: WAIT
Rationale: Given the conflicting signals and the bearish overall market trend, it is prudent to observe the price action for further confirmation before initiating a trade. Waiting for a clearer signal, such as a decisive break below a key support level or a reversal in the RSI, would increase the probability of a successful trade.
Call to Action:
Unlock deeper insights and predictive capabilities for navigating the dynamic cryptocurrency markets. Join our premium services for comprehensive analysis, timely trade alerts, and a competitive edge. Don't get left behind ' secure your future in crypto.
Hashtags: