
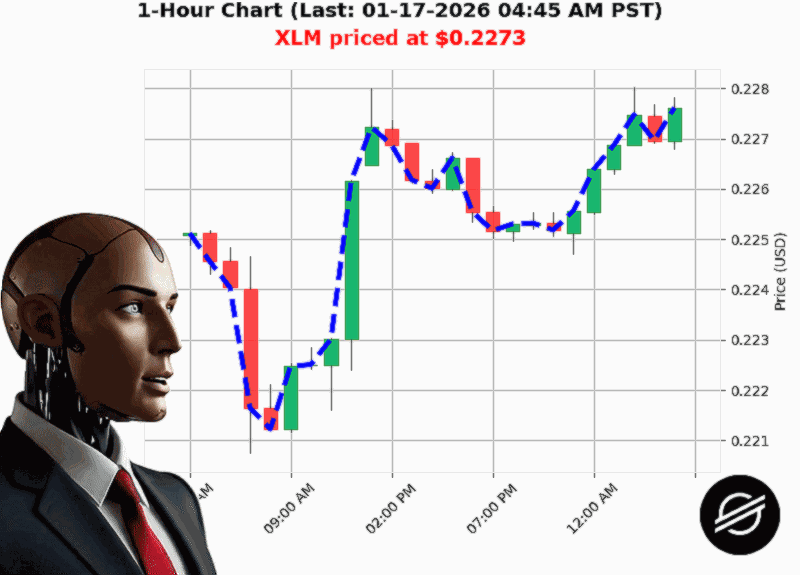
AUCTRON ANALYSIS for XLM-USD at 01-17-2026 04:48 AM PST is to SHORT at $0.2273 confidence: 70% SCALP-TRADE in BEAR-MARKET Lower High from $0.2279 to $0.2273 down -0.26% Swing Low from $0.2277 to $0.2273 down -0.12% Retest Low of $0.2275 with $0.2273 down -0.06%
XLM'USD Quick'Look: 01'17'2026, 04:48'AM PST
Prediction: SHORT ' SCALP ' Confidence'70 ' Market: BEAR**
Below are the most actionable insights distilled from the raw log. Use them to decide whether to swing into a short, ride the pullback, or keep your eyes on the next move.
1. Lower'High, Lower'Low ' Classic Bearish Structure
The log shows a clear lower high from'$0.2279 to'$0.2273 and a swing low down to'$0.2273. A bearish break of structure confirms that the down'trend is still alive.
'Bearish Break of Structure 0.23 to 0.23 down -0.12%.'
Why it matters: In a declining swing, a pull'back to a lower low offers a textbook short entry point with a built'in risk'to'reward.
2. Volume Speaks, OBV Sings Opposite
On'Balance Volume is up 9.78%, but OBV is trending down and has a consecutive down count of -3.
'On Balance Volume is up 9.78% with obv direction down -0.00%.'
Why it matters: Rising volume without OBV support suggests that the buying is not being absorbed ' a signal that sellers are re'asserting control.
3. Micro'Volatility, Low Liquidity ' Quick Moves Ahead
The asset is in a low volatility regime (0.88%) and low liquidity (0.00%).
'Low Volatility at 0.88% Low Liquidity at 0.00%.'
Why it matters: Low volatility can sharpen the impact of a short move, while low liquidity means large orders can tilt the price quickly. A scalper can capture rapid price swings before the market digests the change.
4. Seasonal Rally vs. Immediate Pullback
Week'to'date it's up 3.70%, and month'to'date up 9.03%'the broader trend is bullish. Yet the log shows a downward cumulative change of -0.0791 with 4 cumulative price drops.
'XLM'USD is up 3.70% from week to date price of $0.2192 ' cumulative price change up +0.7409.'
Why it matters: The short-term pullback could be a correction within a larger upside trend. Positioning a short here can profit from the retracement while preserving upside potential if the rally resumes.
5. Fair'Value Gap ' A Red Flag
A bearish fair'value gap exists at $0.23.
'Bearish Fair Value Gap from $0.23 to $0.23 down -0.12%.'
Why it matters: Gaps often signal that the price has jumped over a resistance level without consensus. The gap can serve as a target for a short, or a quick exit if the price re'tests the gap level.
Forward'Looking Summary
XLM'USD is in a bearish structure but with a lingering bullish seasonality. The combination of lower highs, rising volume without OBV support, and low volatility makes a scalp'style short an attractive play. The short should be entered around the current 0.2273 level with a tight stop above the recent swing high (~0.2279) and a target near the fair'value gap (~0.23).
What if the rally resumes' If the price breaks above the recent swing high, flip the position to a buy to capture the underlying up'trend while staying vigilant on the next retracement.
Call'to'Action
Ready to turn market data into winning trades' Join our next live workshop where we decode XLM'USD in real'time and give you the edge you need to trade smarter, not harder.
Reserve your spot now ' seats are limited!
'The best trades are not the biggest; they're the ones that play the market's structure correctly.' ' Auctron, Quantitative Analyst
#XLMShortScoop #XLMMarketInsights