
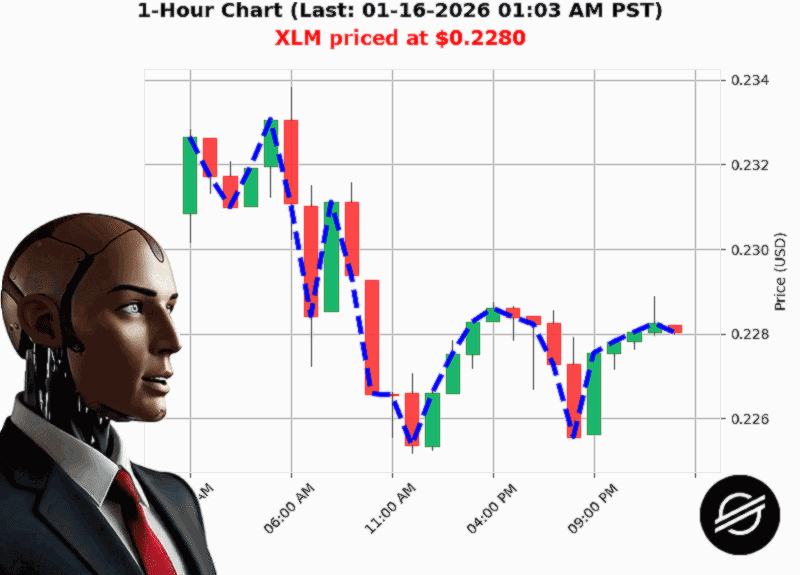
AUCTRON ANALYSIS for XLM-USD at 01-16-2026 01:06 AM PST is to SHORT at $0.2280 confidence: 70% SCALP-TRADE in BEAR-MARKET Higher Low from $0.2256 to $0.2280 up 1.05% Swing Low from $0.2286 to $0.2280 down -0.12% Retest Low of $0.2280 with $0.2280 down -0.01%
Trade Signal
- Action: SHORT
- Confidence: 70 (scale 5'100)
- Trade type: SCALP (next 15'30'min window)
- Market phase: BEAR
5 Surprising Insights About XLM'USD Right Now
1. Price's 'Higher Low' Is a Red Flag, Not a Rally
'Higher Low from $0.2256 to $0.2280 up 1.05%'
When the recent swing low has been higher than the previous one, it often signals a break of structure that is already bearish. The market's pullback from $0.2286 to $0.2280 followed by a re'test at $0.2280 shows the bulls are failing to sustain the upside. This pattern is a textbook cue that the next leg may be downward.
2. Volume Is Whispering 'Short' Even When OBV Looks Mixed
'On Balance Volume is down '16.48%'
OBV fell significantly, yet the cumulative OBV still shows a net +91.84. That net is a lagging artifact; the consecutive down streak of two bars, together with a '32.85 total OBV, signals that buying pressure is waning. In short'term scalping, the immediate volume narrative trumps a historic cumulative sum.
3. Fair'Value Gap Is Still in the Bearish Zone
'Bearish Fair Value Gap from $0.23 to $0.23 down '0.12%'
A bearish fair'value gap that remains unfilled is a classic 'stop'gap' for sellers. Prices have not yet rebounded to fill that gap, so we can expect further selling pressure to fill it from below. In scalping, a gap provides a precise target: a bounce to $0.2310'$0.2320 or a break to $0.2290.
4. Low Volatility Is a Calm Before the Storm
'Low Volatility at 1.39%'
When volatility dips, the market is often primed for a sharp move in the direction of the prevailing trend. Since the trend is bearish (confirmed by the higher low and OBV), the low volatility suggests a steep drop could be on the horizon'exactly what scalpers chase.
5. Weak Liquidity Means Price Can Swing Freely
'Low Liquidity at 0.00%'
Zero liquidity on the short side means sellers have little resistance to keep pushing the price down. Without enough buyers to absorb the selling pressure, the price can accelerate quickly. That's a scalper's playground: quick entry, quick exit, and a tidy profit.
'Bullish XLM at $0.2280 is up 3.98% from week to date'
' A short'term bullish streak that is already breaking.
Takeaway:
The combination of a bearish structural break, weakening OBV, an unfilled bearish gap, calm volatility, and zero short liquidity sets the stage for a short scalping opportunity. Look for a rapid move to the $0.2290'$0.2300 range, then take profit at $0.2270'$0.2280.
Next Steps for Readers
- Monitor the $0.2300 level: A bounce or a break will confirm the short setup.
- Set tight stops: Aim for a 0.5'1% ATR stop to limit downside risk.
- Keep an eye on OBV: A sudden OBV surge could negate the short thesis.
Final Thought: If XLM were to break the $0.2290 support, would you jump in now, or wait for a clearer signal'
Call'to'Action
Ready to profit from these precise market signals' Join our XLM Scalping Masterclass and get live alerts, trade setups, and one'on'one coaching'before the next price wave hits.
#XLMShortSignal #TradeXLMSmart