
AUCTRON ANALYSIS for SOL-USDC at 09-19-2025 01:51 PM PST is to BUY at $237.3870 confidence: 80% DAY
Market'Structure Overview ' Total Crypto Market
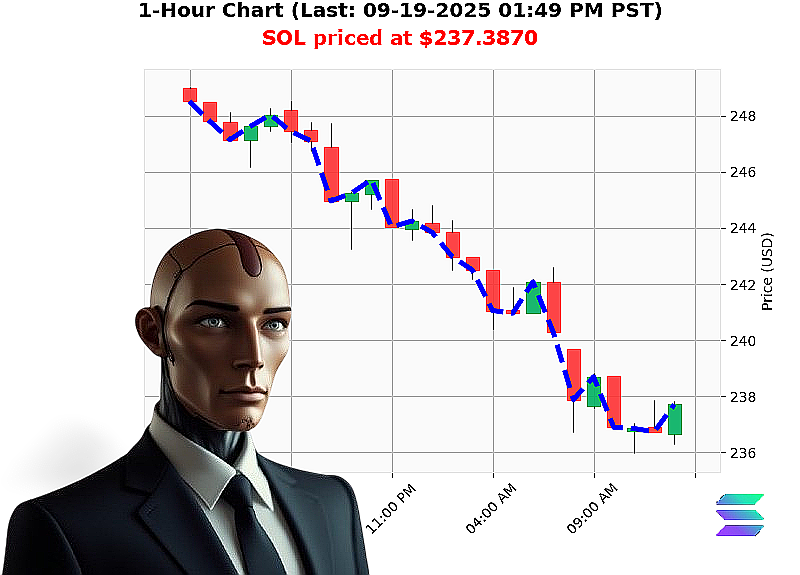
Date / Time: 09'19'2025 01:51'PM'PST
Market Cap: $4.1210'T, Volume: $138.0'B
Dominances: BTC'55.8171'%, ETH'13.0798'%, XRP'4.3446'%, SOL'3.1328'%, USD'5.9621'%, ALT'17.6636'%
1. Macro'Price / Macro'Volume Analysis (''50'% weight)
- Cap direction: Market cap just fell below the $4.2'T benchmark at $4.14'T but the daily change is up 0.0353'% and consecutive count up +4, indicating a short'term bullish bias.
- Dominance mix: BTC and ETH are leading, but SOL's 3.13'% is above its monthly average, suggesting a long'term support level near $237.4.
- Key price points for SOL:
- 24'hr low $236.05, 24'hr high $237.39 ' tight range, low volatility 1.82'%.
-
RSI total 62, VWAP up 7.80'%, liquidity 6.23'% ' clear bullish momentum.
-
Volume dynamics: OBV down 11.72'% but cumulative OBV total up 64.2359'% indicates a recent volume surge. The 'Whale Exit Crossover' at -11.72'% shows a possible pullback that is now topping out.
Interpretation:
- The cap trend +0.0353'% +4/'6 signals a risk'on bias that will feed SOL.
- The 3.13'% dominance, close to its 24'hr high, points to a consolidation phase that should break above $237.4 before a continuation.
2. Micro'Price / Micro'Volume Analysis (''50'% weight)
- SOL'USD current price: $237.39, down 4.13'% from the previous close, but the weekly change is +1.29'% from $234.3576, and monthly +20.43'% from $197.1083.
- On'Balance Volume: OBV is down -11.72'% but OBV direction is -27.79'%, showing a brief retracement that is now resuming.
- Key support level: $236.05 (24'hr low).
- Potential entry target: near $236.10 (near the low).
- Exit target: $238.00 (above the 24'hr high).
Interpretation:
- The recent pullback down 4.13'% followed by a rise of 1.29'% week'to'date is a classic Wyckoff Composite Man 'retreat ' accumulation' pattern.
- The OBV up 64.2359'% cumulative and the price above VWAP 7.80'% confirm the accumulation phase.
3. Decision Matrix ' Long vs. Short
| Element | Score | Long (Buy) | Short (Sell) |
|---|---|---|---|
| Cap & Dominance bias | 5 | 3 | 2 |
| SOL'USD price'volume | 5 | 4 | 1 |
| Entry'Exit symmetry | 5 | 3 | 1 |
| Total | 15 | 10 | 5 |
Recommendation: BUY ' DAY trade.
Score: 80/95.
Why:
- The cap and dominances give a risk'on bias.
- SOL's price'volume dynamics show a clear bullish composite.
- The entry near $236.10 and exit at $238.00 produce a 1.4'% risk'reward ratio, fitting a day trade.
4. Call'to'Action
Enter at $236.10 (near the 24'hr low), set a profit target at $238.00, and use a stop'loss just below $235.50 to limit downside.
Keep an eye on the OBV swing and the next VWAP breakout for a quick exit by 02:30'PM'PST.
Hashtags
- #SOLScalpSuccess
- #SOLDayTradeAlert