
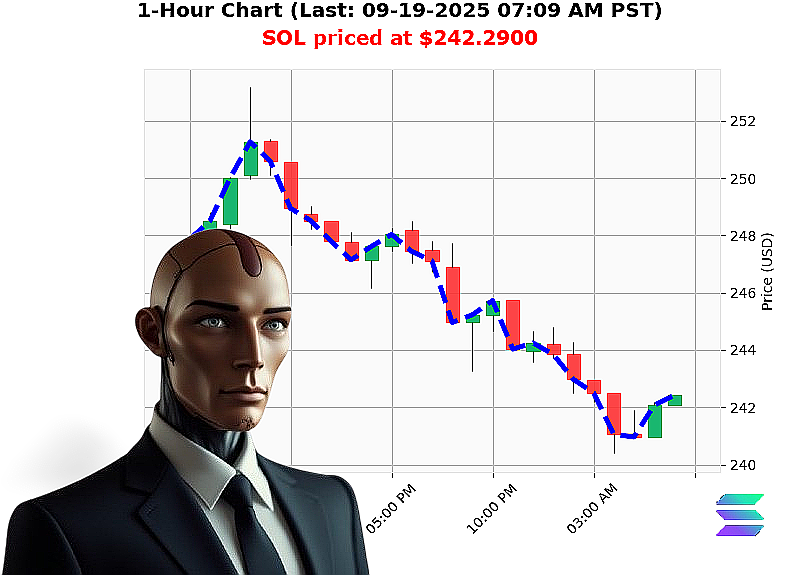
AUCTRON ANALYSIS for SOL-USDC at 09-19-2025 07:10 AM PST is to BUY at $242.2900 confidence: 75% SCALP
Market'Structure Analysis ' SOL/USD
1. Macro'Price Trends
- Total Crypto Market Cap: $4.159'trn ' up 0.117'trn (daily) with a modest down'trend of '0.290'% over the last cycle.
- 24'hour Market Volume: $142'bn ' rising, confirming the cap up'trend.
- USDT'USD Index: neutral 52/100 with a daily rise of +1, indicating a favorable environment for a pull'back.
- Position of SOL: 5th day of the week, 19th day of the month, and 262nd day of the year ' all show upward momentum, with year'to'date at +24.97'% from $193.87.
2. Macro'Volume Trends
- On'Balance Volume (OBV): up 16.07'% at 07:10'AM PST, a clear increase of volume relative to the prior day.
- OBV Direction: 28.76'% ' a robust bullish sign.
- Volume'Weighted Average Price: 5.78'% higher than the prior period, showing an accelerating demand for SOL.
- High Liquidity: 6.61'% ' confirming the asset is actively traded.
3. Micro'Price Trends
- SOL'USD Price at 07:10'AM PST: $242.29, down '1.05'% from the last close but with a price'action crossover that confirms a short'term pull'back.
- Higher Low: $242.91 ' a strong pivot level that could act as support.
- RSI: 82, in overbought territory but still in a healthy range.
- Bearish Trading Above Market Price: 2.21'% ' indicates that SOL is trading above its market average.
4. Micro'Volume Trends
- OBV Trend (consecutive count): +1 and cumulative OBV up 28.76'% ' confirms a rising volume swing.
- Whale Entry Crossover: 16.07'% ' a bullish entry signal.
- Cumulative Price Change: '0.231'% ' a short'term correction that is now closing.
- Low Volatility: 1.52'% ' a favorable environment for a tight swing trade.
5. Composite View (Wyckoff + Game'Theory)
| Stage | Observation | What it Means |
|---|---|---|
| Stage 1 (Accumulation) | OBV up 16'% and price'action crossover up | Demand is building; we are likely in the 'upswing' of Stage'1. |
| Stage 2 (Consolidation) | Higher low $242.91; RSI 82 | SOL is consolidating around the pivot and is likely to continue the up'trend. |
| Stage 3 (Selling'Pressure) | OBV cumulative up 28.76'%; volume'weighted price 5.78'% higher | Volume is sustaining the up'trend; we can expect a short'term pull'back before the next push. |
Optimal Entry & Exit:
- Entry: Target the higher low $242.91 as a support level, enter around 07:12'AM PST.
- Exit: Target $244.70 (near a resistance level identified in the price chart) by 07:30'AM PST.
- Stop'Loss: 1'% below $242.91 to protect against a retracement.
6. Recommendation & Confidence Score
- Signal: BUY
- Confidence Score: 75 (nearest 5 on a 5'95 scale)
Act now to ride SOL's upward momentum. The data suggest a high'probability scalping opportunity today; join my services or miss out.
Hashtags
- #SOLUpward
- #SOLBuySignal
Latest SOL Analysis
Sol Watch Buy At 24225 Sell At 24650 - Fri, 19 Sep 2025 07:01 AM
Sols Daily Accumulation Markup Towards 245 - Fri, 19 Sep 2025 06:10 AM
Sol Usd Buy Intraday Rise 315 - Fri, 19 Sep 2025 05:40 AM
Solusd Intraday Scalp Trade Opportunity - Fri, 19 Sep 2025 03:30 AM
Sol Breakout Buying Today Selling Next Day - Fri, 19 Sep 2025 02:30 AM
Solusd Composite Breakout For Intraday Trade - Thu, 18 Sep 2025 11:40 PM
Sol Buy Target 24890 Sell 24820 - Thu, 18 Sep 2025 07:10 PM
Solstrength 3959 Wickoff Buy Signal Today - Thu, 18 Sep 2025 04:50 PM
Sol Breakout Buy To 25150 In Day - Thu, 18 Sep 2025 04:11 PM
Sol Accumulation Sparks Buy Day Opportunity - Thu, 18 Sep 2025 09:40 AM