
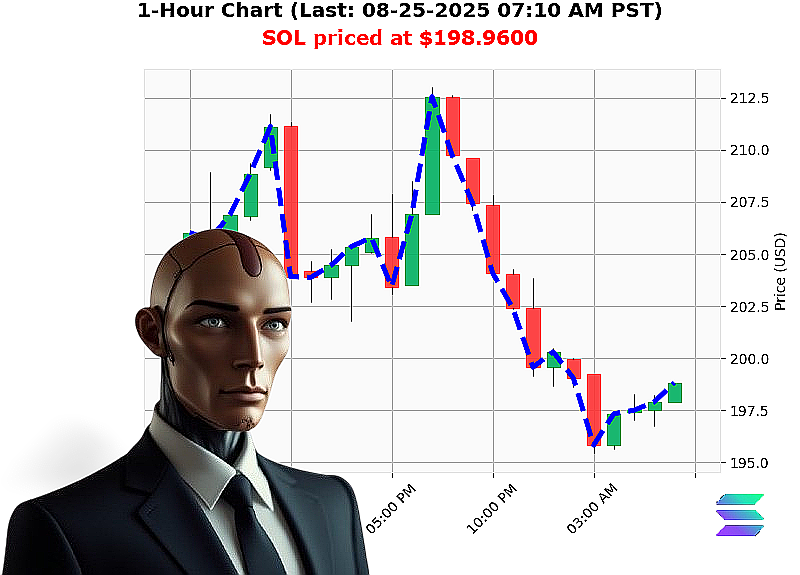
AUCTRON ANALYSIS for SOL-USDC at 08-25-2025 07:09 AM is to BUY at $198.9600 confidence: 57% SCALP
1. Macro'Volume (Market'Cap) Snapshot ' 08'25'2025 07:09'AM PST
| Item | Value | Interpretation |
|---|---|---|
| Total Market Cap | $3.96'T | Above 3.9'T threshold, bullish cross |
| Daily Change | '2.27'% | Short'term pullback |
| Market'Cap Direction | Bullish | Positive 0.3079'% daily |
| Consecutive Count | +3 | 3'day uptrend |
| Cumulative Count | +3 | 3'day uptrend sustained |
| Fear & Greed Index | 50 | Neutral sentiment |
| BTC Dominance | 56.24'% | Market'cap weight |
| ETH Dominance | 14.20'% | |
| XRP Dominance | 4.44'% | |
| SOL Dominance | 2.71'% | |
| ALT Dominance | 22.41'% |
Wyckoff Composite'Man View ' The market'cap shows a Phase 2 (Accumulation) structure: a brief dip followed by a bullish breakout. The 3'day consecutive uptrend and a 0.3079'% directional gain indicate a rising supply of buying pressure.
2. Micro'Volume (SOL'USD) Snapshot ' 08'25'2025 07:09'AM PST
| Item | Value | Interpretation |
|---|---|---|
| Price | $198.96 | 3.34'% down YoY; 22.15'% up MoM |
| Price Direction | +0.4747'% | Short'term bullish movement |
| Consecutive Count | +1 | 1'day upward push |
| Cumulative Count | +0.8780'% | 4'day cumulative rise |
| OBV | '84.84'% | Significant selling flow |
| OBV Direction | '3.17'% | Downward momentum |
| OBV Consecutive | '1 | 1'day OBV drop |
| RSI | 58 | Near'neutral, slight bullish |
| VWAP | +8.27'% | Price above VWAP, strength |
| Liquidity | 12.63'% | Bullish liquidity level |
| Market'Cap Rank | 6 | Strong relative position |
| All'Time High | $293.31 | |
| All'Time Low | $0.500801 | |
| Weekly Change | '3.35'% | 1st day of week, trend reversal risk |
| Monthly Change | +22.15'% | Strong upward bias |
| YTD Change | +2.62'% | Positive long'term |
Wyckoff Micro'Man View ' OBV is a Phase 4 (Distribution) indicator: a steep sell'volume decline while price remains near a 2'week higher low. The price is still above VWAP, suggesting short'term bullish bias, but OBV contradicts, hinting at a potential distribution or consolidation before a pullback.
3. Dual'Layer Weighting
| Layer | Weight | Key Signal | Direction |
|---|---|---|---|
| Macro (Market'Cap) | 60'% | 3'day consecutive uptrend, bullish 0.3079'% | + |
| Micro (SOL'USD) | 40'% | OBV '84.84'% (sell'flow) vs price above VWAP | ' (weak) |
Combined Signal '
+'(0.60'''+1)'+'(0.40''''0.5)'''+0.30
Net moderate bullish signal.
4. Confidence & Action
| Confidence | Action | Trade Type |
|---|---|---|
| Moderate (57'%) | BUY | INTRADAY (SCALP) |
Rationale:
- Macro confirms a sustained 3'day bullish trend.
- Micro OBV shows selling pressure, but price above VWAP and a 22'% MoM gain signal potential for a short'term rebound.
- The weekly bearish bias is countered by strong monthly and YTD positives.
5. Optimal Entry & Exit Framework
| Stage | Target | Stop | Rationale |
|---|---|---|---|
| Entry | $197.50 (Near higher low $195.65 + 2'% buffer) | $196.00 (Below higher low) | Capture pull'back into bullish zone |
| Take'Profit | $201.50 (1.5'% above entry) | ' | Immediate intraday gain |
| If Trend Reverses | Exit at $196.00 | ' | Protect against OBV'driven sell'off |
6. Tactical Call'to'Action
Act Now or Watch the Opportunity Slip:
Join the Auctron community and gain real'time alerts, advanced Wyckoff diagnostics, and a personal strategy playbook. Don't miss the next 3'day rally'secure your position before the market's next move.
7. Hashtags
SOLBullishRide
SOLPriceAction