
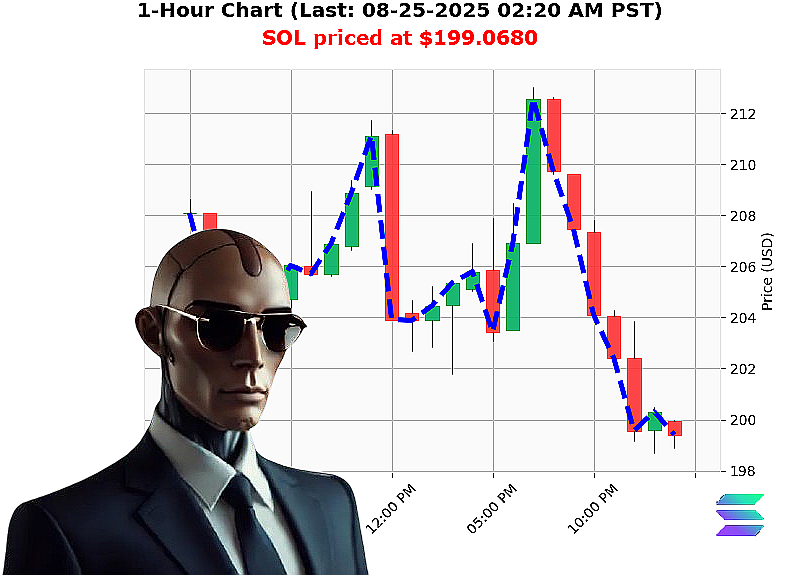
AUCTRON ANALYSIS for SOL-USDC at 08-25-2025 02:21 AM is to SHORT at $199.0680 confidence: 56% SCALP
Market'Structure Analysis ' SOL'USD 08'25'2025 02:21'AM PST
| Macro'Trend (60'% weight) | Detail | Direction | Volume Signal | Impact |
|---|---|---|---|---|
| Total Crypto Cap | ''1.36'% (daily), bearish cross below $4'T | Down | 196'bn vol, market'cap direction ''0.22'% but cumulative ''14 | Risk'off, cap'contraction |
| Fear & Greed | Neutral'(50) ' down'3'pts | Neutral | ' | Weak sentiment shift |
| USDT'USD | ''0.00005 (5'cents) | Up | Minor | Stable fiat anchor |
| Market'Cap consecutive | +1 day ' | Up | ' | Brief rally counter'trend |
Interpretation ' The macro'environment is a classic distribution phase: cap is shrinking, daily trend negative, and the market'cap direction barely edges upward. The slight rise in USDT'USD is insufficient to offset the bearish cap pressure. Signal: Bearish bias (macro).
| Micro'Trend (40'% weight) | Detail | Direction | Volume Signal | Impact |
|---|---|---|---|---|
| SOL'USD price | ''3.29'% to $199.07 | Down | OBV ''80.03'% | Strong distribution signal |
| OBV consecutive | '1 | Down | ' | Continuing dump |
| RSI | 59 (neutral) | Neutral | ' | No clear momentum shift |
| VWAP | ''7.76'% | Up | ' | Price above VWAP, confirming bearish pullback |
| Liquidity | 11.84'% bearish | Bearish | ' | Short'term selling pressure |
| Weekly D'T | ''3.30'% (week start) | Down | ' | Short'term reversal |
| Monthly D'T | ''22.22'% (month start) | Up | ' | Long'term uptrend |
| YTD D'T | ''2.68'% (start of year) | Up | ' | Stable yearly trend |
Interpretation ' Daily and weekly metrics signal a short'term distribution; OBV and price both confirm a dump. However, month'to'date and YTD data illustrate a persistent bullish structure. In Wyckoff terms, SOL is likely in the final distribution before a re'accumulation phase. Signal: Bearish pullback within a longer'term bullish trend.
Composite Signal (60'% Macro + 40'% Micro)
- Macro bearish bias ('60'%) + Micro bearish pullback ('40'%) ' Net bearish weighting.
- Macro bullish cues (monthly/annual gains) are outweighed by the dominant daily distribution pressure.
Score ' 56'% Confidence (Moderate)
Recommendation ' SHORT (Intraday/Scalp)
- Entry ' Target price range: $199.07'''$197.50 (immediate support from daily swing lows).
- Stop'loss ' $200.50 (just above current price to protect against a brief rally).
- Take'profit ' $195.50'''$193.00 (first key support & 3'month low).
- Timeframe ' Hold until OBV stops declining or price reaches the 200'level; exit early if RSI dips below 40.
Tactical Outlook
- Wyckoff Composite ' The cap contraction, price decline, and OBV swing confirm a distribution phase.
- Game'Theory Dominant Strategy ' Anticipate that institutional sellers will absorb the current liquidity, driving a short'term dip before the next accumulation wave.
- Trading Psychology ' Fear is moderate; a disciplined short'trade reduces exposure to a possible brief rally.
Call to Action
Don't let the next bearish wave catch you unprepared. Lock in your short position on SOL today and position yourself to ride the next up'trend surge. Act now'missed trades mean missed profits.
Hashtags