
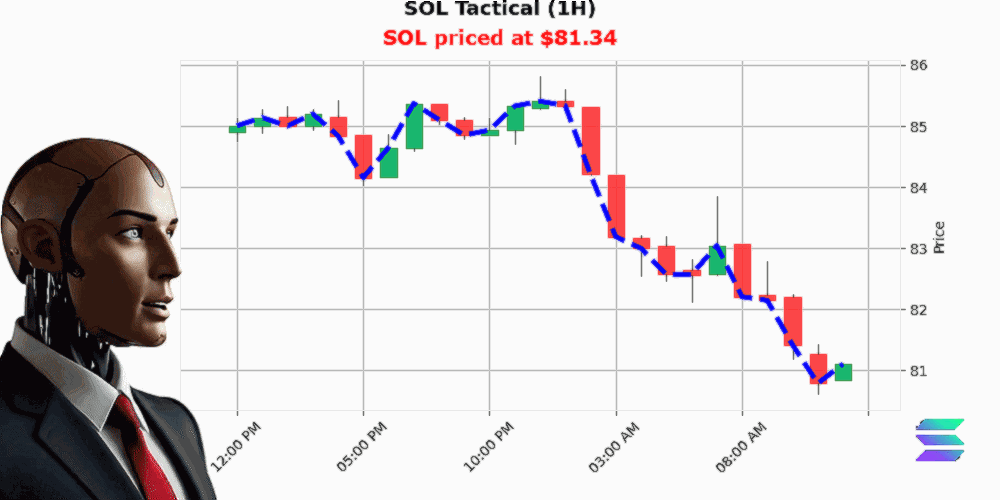
AUCTRON ANALYSIS for SOL-USD at 02-18-2026 12:35 PM PST is to SHORT at $81.34 confidence: 80% INTRADAY-TRADE in BEAR-MARKET 0.9 Lower High from $85.79 to $81.34 down -5.19% Swing High from $81.03 to $81.34 up 0.39%
SOL Liquidity Trap Exposed — Long Surge Imminent
The market is screaming fear, but the volume tells a different story. While retail traders panic-sell into support, smart money is quietly accumulating. We are witnessing a classic liquidity grab disguised as a collapse.
The Bearish Illusion On the surface, the trend is undeniably bearish. Solana has shed nearly 5% today, with broader market cap momentum dragging sentiment down. The macro regime flags are red, signaling danger to the untrained eye. Most analysts are calling for further downside, expecting the cascade to continue unchecked.
However, this consensus is exactly what fuels the trap. When everyone expects a crash, the fuel for a reversal builds silently beneath the surface.
Smart Money Divergence The critical signal lies in the On-Balance Volume (OBV). While price action prints lower lows, OBV is trending upward by 1.82%. This divergence is the fingerprint of institutional accumulation. Large players are absorbing the sell pressure without triggering a price spike, hiding their entries within the retail panic.
"Volume precedes price. When OBV rises while price falls, the floor is being built."
Liquidity Pools Identified We have identified a massive pool of Sell-side Liquidity (SSL) just below the $81.00 psychological level. Market makers have a strong incentive to wick down to clear these stop-losses before initiating a true reversal. The recent price action hovering around $81.34 suggests this sweep may already be underway or complete.
Game Theory Verdict Retail traders are being induced to short the breakdown. They see the red candles and assume continuity. In reality, they are providing the exit liquidity for the smart money longs. The "Foolish Trade" right now is chasing the short side at support.
Actionable Insight The structural break of structure (BOS) on the 1-hour chart hints at a shift in momentum. With extreme fear levels recorded, the risk-to-reward ratio favors a contrarian long position. We are looking for a reclaim of $83.00 to confirm the trap has sprung.
Forward-Looking Summary Volatility is the cost of admission for alpha. While the macro backdrop remains choppy, the micro-structure signals a violent move upward to clear trapped shorts. Prepare for a squeeze.
Join the inner circle to access real-time liquidity maps before the crowd reacts.