
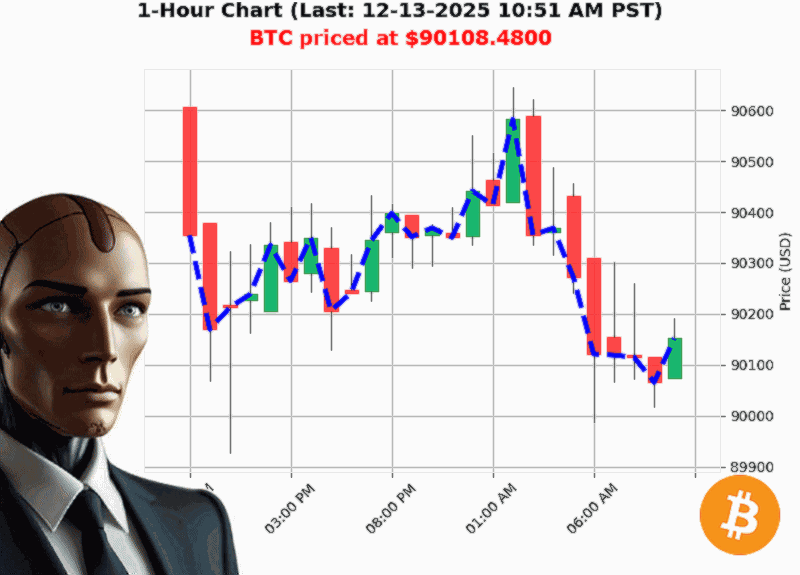
AUCTRON ANALYSIS for BTC-USD at 12-13-2025 10:54 AM PST is to SHORT at $90108.48 confidence: 70% DAY-TRADE in RANGE-MARKET Lower High from $90614.31 to $90108.48 down -0.56% Swing Low from $90160.00 to $90108.48 down -0.03% Retest Low of $90139.77 with $90108.48 down -0.03%
** BTC-USD: What the Numbers Are Saying (10:54'AM PST, 12'13'2025)
*Prediction: SHORT ' DAY (Score'70/100)
Market mood: Bearish* (with tight'range consolidation)
1. Market Structure Snapshot
BTC'USD opened near $90,108 and has slipped 0.19'% since. The price is currently breaking its recent low (90139.77'''90108.48), a textbook bearish 'Break of Structure.'
'Bearish Break of Structure 90139.77 to 90108.48 down -0.03%.'
The crypto'market cap, however, is up 0.18'% today, indicating that liquidity is still flowing into the market overall. The slight uptick in market cap contrasts with BTC's downward move, hinting at a potential range'bound state rather than a full'scale crash.
2. Price Structure Woes
- Cumulative downward count: -4, consecutive downward count: -3
- Price change: -8.15'% cumulative, -7'% consecutive
- Low volatility: 0.78'% and zero liquidity
BTC is carving a tight'range between 90,614.31 (lower high) and 90,160.00 (swing low). The recent retest at 90,108.48 is not a breakout but a pull'back within the current structure.
3. Volume Structure Signals
- OBV direction: +1.05'% (up)
- OBV consecutive count: +6, cumulative count: +53
- High'volume bearish spike: -500'% (i.e., heavy selling volume)
Despite a down'trend in price, OBV's upward movement signals accumulation pressure'a possible early'stage reversal cue. Yet the heavy bearish volume spike warns of imminent selling pressure that could push the price back down.
'Strong Short OBV Bearish BTC at $90108.4800.'
4. Key Drivers
| Driver | Signal | Impact |
|---|---|---|
| Week'to'Date Trend | Down 0.59'% | Short'term bearish bias |
| Month'to'Date Trend | Up 4.39'% | Bullish momentum at a higher timeframe |
| Year'to'Date Trend | Down 4.57'% | Long'term bearish tilt |
| USDT'USD Stability | Flat | Provides a reliable base for pair trades |
The mix of a bearish week'to'date trend, bullish monthly trend, and bearish YTD trend creates a contradiction that favors a short'term range play.
5. Risk Factors
- Low liquidity can cause slippage during entry/exit.
- High bearish volume may trigger a quick pullback.
- Market'cap up vs. BTC down could signal a shift to alt'coins, diluting BTC demand.
- Regulatory news is always a wild card in crypto.
6. Actionable Trade Insights
- Entry: Short at $90,108 if a retracement to the lower swing low (90,160) occurs.
- Stop'Loss: Set just above the recent high $90,160 to limit exposure to a breakout.
- Take'Profit: Aim for the lower high $90,614 or a quick 0.5'% dip (''$90,045) if volatility spikes.
- Timeframe: Ideal for a DAY trade; avoid longer horizons until the bearish structure resolves.
Given the OBV upswing and the bearish price break, the most prudent play is a short on the day'capitalizing on the anticipated pullback to the lower swing low before the structure possibly reverses.
Final Thought'Provoking Question
If BTC continues to trade within this tight range, will the accumulation pressure from OBV finally tip the market toward a bullish breakout, or will the bearish volume sustain the downtrend'
Call to Action
Want real'time signals that keep you ahead of these twists and turns' Join my premium research service for instant alerts, deeper data fusion, and a community of traders who turn volatility into profit. Don't let another dip slip by'get the edge today!
#BTCAlert #BTCInsights