
AUCTRON ANALYSIS for BTC-USD at 12-11-2025 02:24 PM PST is to SHORT at $92552.85 confidence: 70% SCALP-TRADE in BEAR-MARKET Bearish BTC price dropped below $92600.00 to $92552.85 down -0.16% Higher Low from $89417.29 to $92552.85 up 3.51% Swing Low from $92960.30 to $92552.85 down -0.12%
** 5 Surprising BTC Insights That Can Change Your Trading Game**
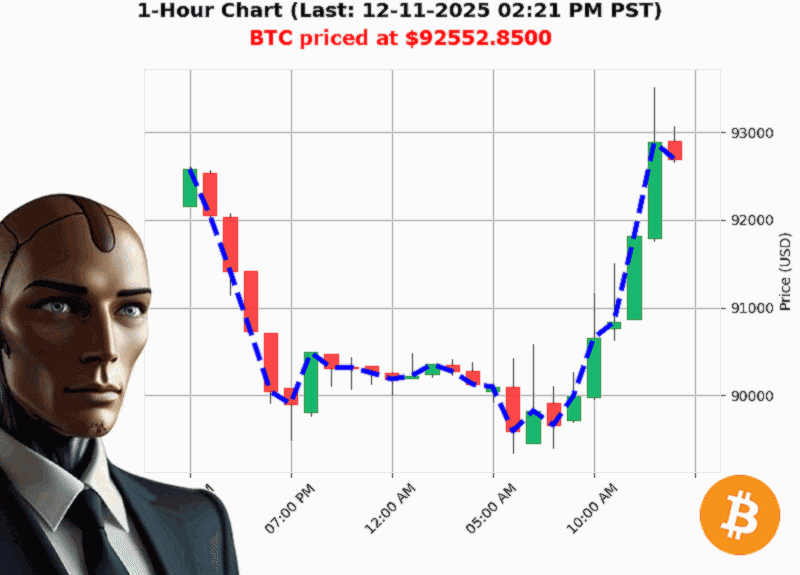
'Bearish BTC at $92552.8500 is down -1.98% from year'to'date price of $94419.7578.'
'Market Data Snapshot, 12'11'2025 02:24'PM PST
1.'Break'of'Structure: The Dark Cloud Over 92,600
- BTC just slipped below $92,600 to $92,552.85, a 0.16'% drop.
- The break'of'structure (from 92,660.16 ' 92,552.85) is a classic bearish flag.
- In a short'term context, this is a red flag for intraday or scalp setups.
- Takeaway: If you're looking for a quick play, don't wait for a rebound'consider a short.
2.'OBV is a Volatile Volume Whisperer
- On'Balance Volume (OBV) is up 93.93% year'to'date, but its direction is down -0.79% today.
- OBV's consecutive count shows -2 days of decline and a total down -0.9657.
- Yet OBV's cumulative count up +5 and cumulative total up +1,558.42 hint at a lingering buying bias.
- Takeaway: Volume is telling two stories'an overall bullish foundation, but today's selling pressure is still dominant.
3.'Market'Cap Decline: The Macro Bearish Engine
- The total crypto market cap is $3.235'trillion, down -0.63% for the day.
- Market'cap direction is bearish at -0.2918% with -5 consecutive days of decline.
- A market'cap drop usually correlates with a risk'off environment, tightening support for BTC.
- Takeaway: The broader crypto landscape is tilting downward, so short'term gains may be harder to sustain.
4.'Week & Month to Date: Short'Term Bullish Momentum
- Weekly: BTC is up +2.11% from the week'open ($90,640.20).
- Monthly: BTC is up +7.22% from the month'open ($86,321.57).
- These positive swings suggest that, on a 1'week or 1'month horizon, BTC can still rally.
- Takeaway: Short'term traders can ride the existing momentum'if you're a swing or mid'term player, this may outweigh daily bearish signals.
5.'Year'to'Date Decline: Long'Term Bearish Trend
- BTC is -1.98% YTD from $94,419.76, with 345 days elapsed in the year.
- The 1'year trend remains negative, which is a cautionary sign for holding through volatility.
- Takeaway: Over a longer timeframe, BTC still faces a bearish outlook, implying that a single day of upside may be a temporary correction.
ACTIONABLE TRADE INSIGHT
| Trade Type | Recommendation | Stop'Loss | Target |
|---|---|---|---|
| Intraday / Scalping | SHORT BTC'USD | 0.30'% above entry | 0.50'% below entry |
| Day Trade | WAIT until confirmation of a pullback to $93,800 | Use the 93,800 level as a buffer | Look for a bounce to $94,200 |
Why Short'
The combination of a break'of'structure, bearish OBV direction, and a declining market cap signals that the current rally is likely unsustainable for the next few hours. A tight stop'loss protects against a quick reversal while allowing for a moderate profit if the bearish bias holds.
Confidence Score: 70 (on a 5'100 scale).
We're moderately confident in the short signal, but the week'to'date bullishness keeps the possibility of a quick rebound alive.
Market Mood: Bearish (Short'Term)
The data points toward a short'term bearish environment despite longer'term bullish touches.
Final Thought
Will the short'term bullish momentum survive the bearish macro backdrop' The market's dual signals demand a disciplined, tight'stop approach'don't let the allure of a quick rise blind you to the underlying bearish fundamentals.
Ready to Turn Market Signals into Profits'
Join Auctron's Elite Crypto Edge for algorithm'driven insights, real'time alerts, and personalized trade setups. Don't miss the next wave'subscribe now.