
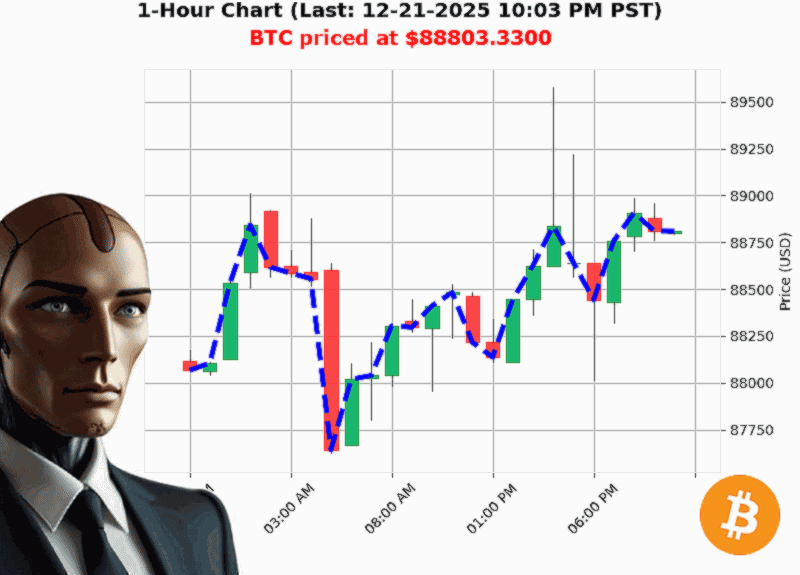
AUCTRON ANALYSIS for BTC-USD at 12-21-2025 10:06 PM PST is to SHORT at $88803.33 confidence: 75% INTRADAY-TRADE in BEAR-MARKET Bullish BTC price crossed above $88800.00 to $88803.33 up 0.01% Higher Low from $88168.57 to $88803.33 up 0.72% Swing Low from $88886.34 to $88803.33 down -0.01% Retest Low of $88792.73 with $88803.33 down +0.01%
BTC'USD 12'21'2025: A Tight'Fisted Forecast
Market Snapshot
At 10:06'PM PST BTC sits $88,803.33, up 0.20'% since the session opened. The daily tick is barely moving'just a 0.01'% lift from the $88,800 mark'yet the underlying structure is telling a story of caution.
'Bullish BTC at $88,803.33 is up 2.88'% from month'to'date, but down '5.95'% YTD.'
''Crypto'Cap
Price Structure ' A Fair'Value Conundrum
- Higher low: From $88,168.57 to $88,803.33, the pair nudged higher by 0.72'%'a classic bullish sign.
- Swing low: The most recent swing low barely dipped to $88,803.33, a mere 0.01'% drop from $88,886.34.
- Retest & Fair'Value Gap: The price retested the low of $88,792.73, closing slightly higher. Yet, a bearish fair'value gap sits just above the $88,809.75'$88,811.29 corridor, signaling a short'term resistance.
Bottom line: The price is flirting with a bullish rebound, but the fair'value gap and break'of'structure flags suggest it could be a false'break.
Volume Dynamics ' On'Balance Volume (OBV) vs. Market'Cap Momentum
- OBV: Up 22.75'% overall, yet the direction is down '0.08'% with a consecutive count of '1.
- Market'Cap: The total crypto cap is up 0.74'% daily, yet the direction reads '0.1045'%.
The contradiction'volume on the rise but directional sentiment turning negative'signals an incomplete confirmation of bullish strength.
Liquidity & Market Sentiment
- Low Liquidity: At only 1.54'% liquidity, the market is thin; a single large order could swing the price significantly.
- Bearish Break'of'Structure: The move from $88,811.29 down to $88,803.33 is flagged as bearish.
A low'liquidity environment coupled with a bearish break'of'structure usually spells caution for long traders.
Risk Factors & Why You Should Watch
- Potential False'Break: The price just crossed above $88,800 but is immediately flirting with a bearish fair'value gap.
- Thin Liquidity: Any sizable buy order could push the pair above the gap, but the gap could also act as a resistance.
- Conflicting Momentum: OBV is positive overall but shows a downward direction; the market cap shows the opposite.
These factors create a high'probability short'term pullback scenario.
Actionable Trade Insight
Trade Type: INTRADAY
Signal: SHORT
Confidence Score: 75 (nearest 5)
Why'
- The price is currently below the fair'value gap and shows a bearish break'of'structure.
- OBV's downward direction and thin liquidity heighten the risk of a quick retracement.
- An intraday short can capture the expected pullback before a potential reversal at the gap.
Set Your Stop'Loss: Just above the $88,811.29 fair'value zone.
Target: $88,750'$88,700, where the lower swing low and lower liquidity should provide support.
Market State
Bearish (with a potential short'term consolidation).
Final Thought
Is the market ready to honor the fair'value gap, or will it break through and force a rapid retracement' Your next move could hinge on how quickly the price reacts to the next block of liquidity.
Take Action
Don't let the next candle decide your fate. Join our premium service today for real'time alerts and custom trading signals that keep you ahead of the curve.
#BTCWatch #CryptoEdge