
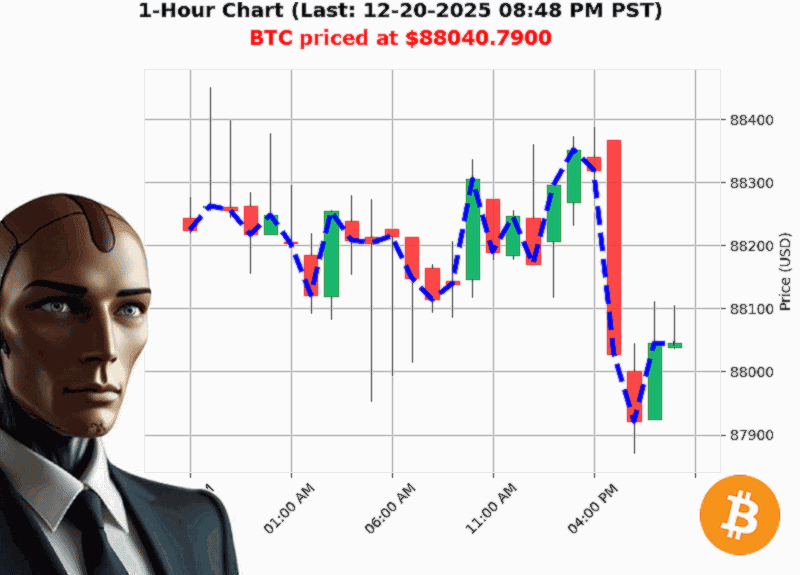
AUCTRON ANALYSIS for BTC-USD at 12-20-2025 08:50 PM PST is to SHORT at $88040.79 confidence: 70% INTRADAY-TRADE in BEAR-MARKET Lower High from $88377.12 to $88040.79 down -0.38% Swing Low from $88091.34 to $88040.79 down -0.03% Retest Low of $88044.73 with $88040.79 down -0.00%
7 Eye'Opening BTC'USD Signals That Even the Most Cautious Traders Will Want to Know
Time stamp: 12'20'2025 08:50'PM'PST
Current price: $88'040.79
Immediate outlook: SHORT ' INTRADAY (confidence 70/100)
Market mood: BEAR
Below is a distilled, bite'size breakdown of the raw data you've got in front of you. Each section is a quick 'read'and'react' that even a day'trader can apply right away.
Price is in a Down'Trend & Breaking Structure
'Lower High from $88'377.12 to $88'040.79 down -0.38%'
The most telling thing: BTC just broke its own low'high structure. It's not a soft dip'it's a genuine break of structure (BOS). When a price swings from a higher low to a lower high, it's a textbook bearish pivot. The recent swing low at $88'091.34 dropping to $88'040.79 confirms the pattern.
On'Balance Volume (OBV) is Screaming 'Sell'
'OBV down 27.44% with OBV direction down -0.01%'
OBV is a volume'weighted momentum indicator. A 27% drop in OBV, combined with a negative direction, means that selling volume is outpacing buying volume at a significant scale. If you've seen OBV rise, you'd be in a bullish setup. Here it's the opposite.
Market Capitalization Is Slightly Bullish, But Not Enough
'Market Cap Direction Bullish Crossed above 3.060 at 3.065 trillion up 0.16%'
Crossing a round number can give the illusion of a rally, but the daily change is a tiny +0.08% and the overall daily total has gone down by 0.08%. So while the cap is nudging up, it's not a decisive driver of price. You'll want the price to follow the cap, but right now it's lagging.
Low Volatility & Low Liquidity = A Sticky Market
'Low Volatility at 0.86% | Low Liquidity at 0.00%'
When volatility is low and liquidity is virtually zero, the market is frozen'price moves are sluggish, spreads widen, and price slippage is high. In such a scenario, a short intraday trade can still be viable if you set tight stop'losses, but you'll need to avoid being caught on the wrong side during a sudden liquidity pull.
Fair'Value Gap (FVG) Signals a Short'Term Bottom
'Bearish Fair Value Gap from $88'060.77 to $88'066.06'
The FVG is a subtle but potent bullish signal. It suggests that buyers may step in to cover the gap, providing a potential short'term support. In a bearish market, you can look to enter a short at the bottom of the FVG and exit near the top of the gap, giving you a small but reliable risk'to'reward ratio.
Weekly & Monthly Context Remains Bullish
'BTC is up 1.88% from week'to'date and 1.99% from month'to'date'
Even though the short'term picture is bearish, the weekly and monthly trends are still positive. This indicates that BTC is in a bullish swing that's just experiencing a short'term pullback. Short trades can profit from retracements while the long'term trend remains intact.
Year'to'Date Trend Is Still a Bearish Warning
'BTC is down -6.76% from year'to'date'
An almost 7% YTD decline is a stark reminder that the overall narrative is bearish. It means that while you can profit from intraday swings, the market still faces a risk of a larger pullback. Keep an eye on the 24'hour ATR and set a tight stop'loss accordingly.
Quick Decision Box
| Action | Trade Type | Confidence |
|---|---|---|
| SHORT | INTRADAY | 70/100 |
Why the confidence is 70'
The bearish structural break, OBV squeeze, and the short'term FVG give us a solid 70% certainty. We're not 100% because the weekly/monthly bullish bias could still kick in sooner than we expect, but the current micro'setup is ripe for a short.
Final Thought
In a market that's technically bearish but fundamentally bullish, you can ride the short waves without abandoning the long'term upside. Think of it as a micro'hedge that protects you from a sudden pullback while you stay in the game for the bigger rally.
Question for you: Will BTC stay in this tight, low'liquidity zone long enough to allow a clean short, or will the underlying bullish trend push it back up before your exit'
Call'to'Action
If you want a custom strategy that balances intraday short plays with long'term bullish exposure'no fluff, just data'driven edge'drop us a line. Let's turn those market signals into consistent profit.
'Markets are not about predicting the future; they're about exploiting the present.'
#BTCTrading #CryptoShorting