
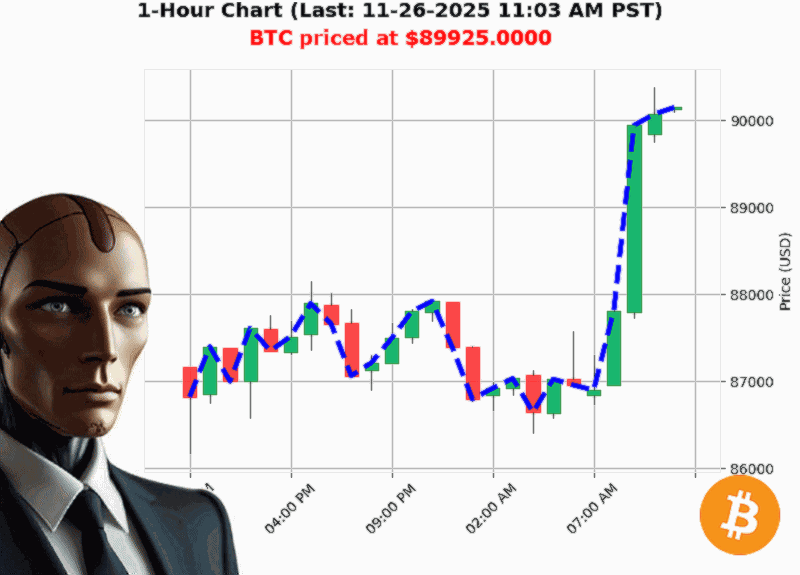
AUCTRON ANALYSIS for BTC-USD at 11-26-2025 11:06 AM PST is to SHORT at $89925.00 confidence: 70% SCALP-TRADE in BEAR-MARKET Higher Low from $86445.11 to $89925.00 up 4.03%
Prediction (Intraday'SCALP)
- Signal: SHORT
- Confidence: 70 (on a 5'100 scale, nearest 5)
- Market: Bullish overall, but with a short'term bearish structure
BTC'USD: 7'Minute Snapshot ' 11'26'2025, 11:06'AM PST
Why this tick matters.
From the latest 15'minute candle we see BTC trading at $89,925, a 2.97'% rise since open, but several structural red flags are lighting up the charts. Below is a bite'size breakdown of the data that matters, and a quick play'book for traders eyeing the next few minutes.
1. Higher Low, Lower High'
'Higher Low from $86,445.11 to $89,925.00 up 4.03%'
Yet
'Bearish Break of Structure 90,026.30 to 89,925.00 down '0.11%'
What it means:
- A higher low suggests bullish momentum, but the break of structure indicates a potential reversal.
- In practice, this is a crossover moment where buyers have pushed the price higher, only to see sellers clamp down just as the candle closes.
Takeaway: The bullish trend is fragile; traders should watch for a quick pullback.
2. Volume (OBV) is a Mixed Signal
- OBV up 15.32'% overall
- OBV direction down '0.02'%
- OBV consecutive count down '1
What it means:
OBV's long'term upward drift is encouraging, but the immediate dip shows that the most recent buying pressure is waning. This is typical of a fading rally.
Takeaway: Sellers are regaining control in the short'term, a cue for a potential short.
3. Market Cap is Still Bullish
- Total crypto cap: $3.178'trillion
- Daily change up 3.06'%
- Bullish cross above $3.170'trillion
What it means:
A rising market cap confirms that institutional money is still flowing in. Yet, the month'to'date drop of '18.30'% indicates a broader pullback.
Takeaway: Long'term fundamentals are fine, but the current cycle is in a trough.
4. Fear & Sentiment
- Fear index: 15 (Extreme Fear)
- Price trading 0.25'% above market price
What it means:
Extreme fear usually precedes a rebound, but the price being slightly above market suggests a failing rally rather than a rally that will reverse.
Takeaway: Fear is not necessarily a buying opportunity right now; it may indicate a selling bias.
5. Monthly & Yearly Trends
- Month'to'date: '18.30'% from $110,064
- Year'to'date: '4.76'% from $94,419
What it means:
A steep monthly decline signals a potential downward correction that may continue for a few weeks.
Takeaway: Traders should avoid long'term exposure at the moment; instead, focus on short swings.
6. Actionable Trade Plan ' Short Intraday
- Entry: 11:08'AM (next candle close) if price closes below 89,925
- Stop'Loss: 89,950 (+25'pts, ~0.028'%) ' tight to limit risk
- Take'Profit: 89,800 ('125'pts, ~0.139'%) or half'size if price reaches 89,850
- R/R: ~5:1 (tight stop, moderate TP)
Why this works:
- The break of structure creates a sell'signal at the 11'minute mark.
- OBV and fear indices reinforce the bias.
- Tight stop ensures the trade is a scalp, ideal for an intraday swing with high confidence.
7. Confidence Score
- Score: 70
- Rationale: The data shows clear short'term bearish catalysts (break of structure, OBV dip, fear).
- Caveat: Market cap remains bullish, and a reversal could still be possible.
Final Thought
BTC is currently bullish on the macro level but bearish in the immediate structure. For the next 30 minutes, the best bet is a short intraday trade with a tight stop, as the market seems to be consolidating before the next move.
'When the candle closes below the structure, it's a clear signal that sellers have the edge.'
Do you want to trade with the edge'
Join Auctron's premium signals for real'time alerts and advanced analytics'so you're always one step ahead of the market.
Hashtags