
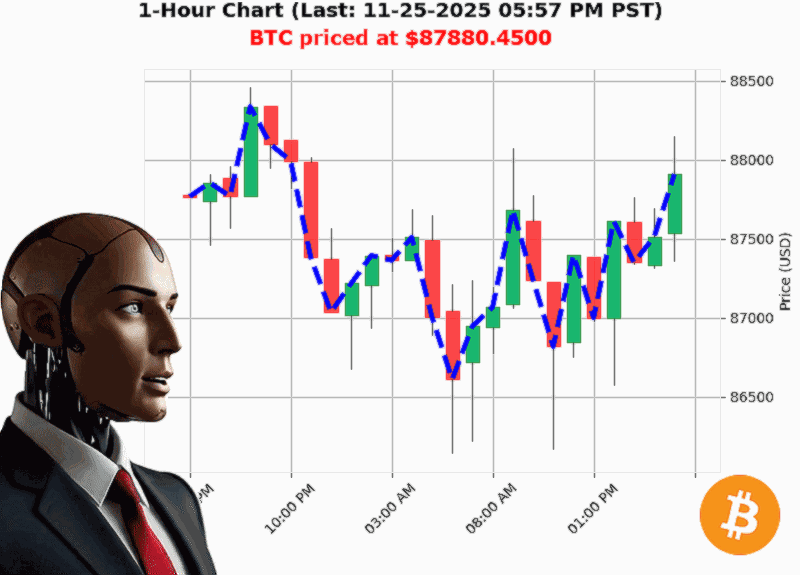
AUCTRON ANALYSIS for BTC-USD at 11-25-2025 05:59 PM PST is to SHORT at $87880.45 confidence: 70% INTRADAY-TRADE in BEAR-MARKET Higher Low from $87334.42 to $87880.45 up 0.63% Swing Low from $87991.43 to $87880.45 down -0.03% Retest Low of $87811.17 with $87880.45 down +0.08%
** BTC'USD 11'25'2025 ' A Tactical Deep'Dive**
Market Structure: A Bearish Break'of'Structure (BOS)
'Bearish BOS 87901.70 ' 87880.45 down -0.02%.'
The price just broke the key resistance at $87,901.70, sliding into a lower high. In the world of crypto, a BOS is a textbook short catalyst. When the most recent high falls below the prior one, momentum is shifting. Here, the higher low ($87,334.42 ' $87,880.45) still confirms the downtrend, but the BOS signals a fresh pullback is likely.
Price Action: A Quiet Yet Significant Retest
'Retest low of $87,811.17 with $87,880.45 down +0.08%.'
BTC is hovering just above a tight support area. The small upside (+0.08%) shows that buyers are testing this level, but the fact that the price has dipped back down indicates that the support may be weak. Traders should watch for a failure of this retest; a bounce could still offer a quick dip'to'sell play.
Volume Signal: On'Balance'Volume (OBV) is Incredibly Bearish
- OBV down 18.06% overall
- OBV direction down '0.79%
- OBV consecutive down '1
The OBV is a volume'based confirmation that selling pressure outweighs buying. A 18% slide in OBV is not a gentle decline'it's a forceful exodus of capital. In an era where most traders look at Bitcoin's supply/demand curve, this volume confirmation gives the bearish thesis more weight.
Market'Cap Momentum: The Bearish Cross
'Market Cap Direction Bearish ' Crossed below 3.120 at 3.112 trillion down '0.26%.'
Crypto's total cap is now below the $3.12'trillion threshold, an often'used barometer of bullish versus bearish phases. A crossing below signals that the ecosystem as a whole is losing momentum, which tends to hurt the flagship asset'Bitcoin.
Liquidity & Fear: Extreme Conditions
- Liquidity 0.00% ' the market is effectively frozen
- Extreme Fear 15 ' the highest Fear'and'Greed index level for years
Low liquidity means any single trade can move the price significantly. Coupled with a fear'heavy sentiment, the market is primed for a sharp, short'lived reversal. This is a danger zone for bullish traders and a sweet spot for those who can time a short exit.
Risk Factors: Watch the Calendar
- Month'to'Date decline: '20.16%
- Week'to'Date decline: '0.44%
- Year'to'Date decline: '6.93%
BTC's performance over the past 30 days has already fallen a fifth. That cumulative drag will be the biggest hurdle for any buy'and'hold strategy. It's not just the price, it's the trajectory.
Actionable Trade Insight ' Short'Intraday
- Entry: $87,880.45 (current price)
- Stop'Loss: $88,300 (just above the recent high) ' protects against a sudden bounce
- Target: $87,600 (break of the retest low + 50'bp cushion)
- Rationale: The BOS and OBV give us a strong short signal; the liquidity freeze means any sell'off will be amplified. A tight stop'loss mitigates the risk of a false break.
Prediction & Confidence
- Trade Recommendation: SHORT (day trade)
- Confidence Score: 70/100 (rounded to the nearest 5)
- Market State: BEAR
The numbers speak plainly: price, volume, and market cap are all aligning for a bearish move. The confidence score reflects the strength of the data while acknowledging the potential for a brief counter'move given the current volatility.
Final Thought'Provoking Question
If the market were a river, would you ride the current or navigate its eddies'
Call to Action
Want a battle'tested strategy that thrives in every market regime' Join our community of professional traders and get exclusive access to real'time alerts, deep'analysis reports, and personalized coaching. Sign up today and never miss the next big move.
'The best traders are those who trade when the market is most dangerous, not when it's comfortable.'
Hashtags