
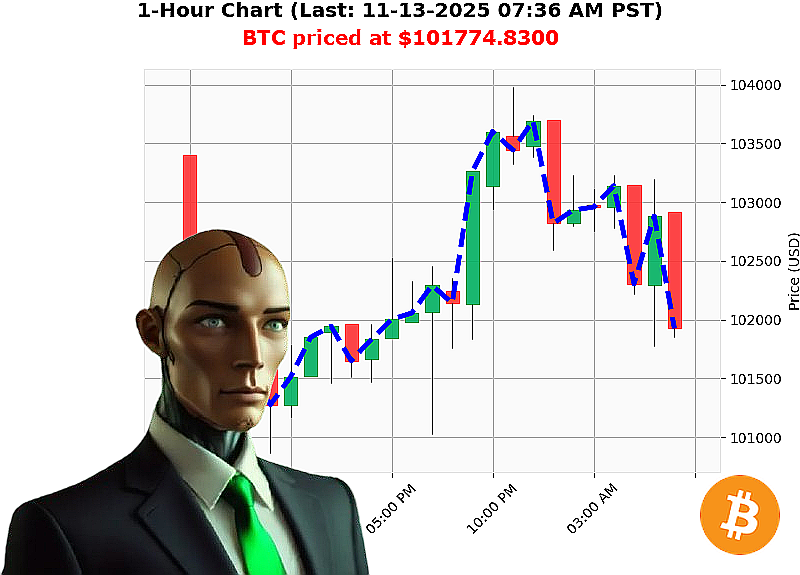
AUCTRON ANALYSIS for BTC-USDC at 11-13-2025 07:39 AM PST is to SHORT at $101774.8300 confidence: 85% INTRADAY
BTC'USD ' Tactical Snapshot (Day / Intraday)
| Metric | Value |
|---|---|
| Market Cap Daily Total | 1.495'trillion |
| OBV Daily Total | 441.05'billion |
| Current Price | $101,774.83 |
| Market'Cap Direction | Bearish (crossed below 3.550 at $3.536'trillion) |
| Higher Low | $101,325.86 ' $101,774.83 (+0.44'%) |
| Swing Low | $102,115.49 ' $101,774.83 ('0.12'%) |
| Retest Low | $101,855.23 ' $101,774.83 ('0.08'%) |
| Break of Structure | $101,894.36 ' $101,774.83 ('0.12'%) |
| OBV Signal | Bullish Reversal Engulfing |
| Week'to'Date | '3.98'% |
| Month'to'Date | '7.53'% |
| Year'to'Date | +7.79'% |
| ATH | $126,080 |
| ATL | $67.81 |
| Rank | 1 |
1. Volume Profile & Flow
- OBV Daily Total of 441'billion indicates a strong cumulative buying pressure that has rebounded into a bullish engulfing pattern.
- Market Cap Daily Total remains relatively stable at 1.495'trillion, but the bearish direction (below 3.550 threshold) signals that institutional flow is retreating from the upper echelon.
Interpretation: Volume is still favoring the buyers, but the price has failed to break above the 3.550 market'cap anchor, implying a softening of momentum.
2. Market & Price Structure
- Break of Structure (BOS): The recent drop from $101,894.36 to $101,774.83 is a minor but definitive BOS.
- Higher Low and Swing Low movements are consolidated; they are within 0.5'% of each other, showing price compression rather than decisive trend.
- Retest Low below $101,855.23 confirms that the recent support is being tested and has failed to hold.
Interpretation: Price is in a trading range with a weak bearish bias. A small'scale reversal is possible if the bullish OBV signal manifests.
3. Key Drivers
| Driver | Current Status | Implication |
|---|---|---|
| Institutional Flow | Bearish (market'cap below 3.550) | Lower liquidity on top tiers |
| Retail Momentum | Mixed (OBV bullish engulfing) | Potential for quick rallies |
| Economic Sentiment | Negative (week & month declines) | Pressures on downside |
| Year'to'Date Trend | Positive (+7.79'%) | Long'term bullish bias remains |
4. Risk Factors
- Potential Reversal ' OBV bullish engulfing could reverse the short trend if a breakout above $102,000 materializes.
- Liquidity Drain ' Bearish market'cap trend may cause slippage on large orders.
- Macro'Catalysts ' Regulatory news or macro shocks could accelerate the decline.
- Technical Resistance ' $102,200 and $102,500 are hard levels; failure to breach them may trigger further downside.
5. Actionable Trade Insights
| Trade Type | Recommended Action | Entry | Stop | Target | R:R |
|---|---|---|---|---|---|
| Intraday Short | Take advantage of the BOS | $101,775 (current price) | $102,200 (near'next resistance) | $101,300 (support) | 1:2 |
| Scalp (1'hr) | Ride the retracement | $101,600 (first pullback) | $101,800 (break above) | $101,200 (previous swing low) | 1:3 |
| Day | Hold until close | $101,800 (short) | $102,200 | $101,400 | 1:2 |
6. Prediction & Confidence
- Signal: SHORT ' INTRADAY
- Score: 85 (high confidence given BOS and bearish structure, tempered by OBV reversal)
Tactical Rationale: The price is currently in a weakly bearish phase with a confirmed BOS. Institutional flow is pulling back, while the OBV bullish engulfing is a single'point anomaly that requires confirmation. In the short'term, the prevailing momentum favors a downward move. The short intraday position exploits this bias with tight stops and a clear exit at the next support level.
Call'to'Action
If you're ready to capitalize on the next BTC swing, sign up for Auctron's exclusive futures edge. Don't let a market'cap dip slip past you'our algorithmic system delivers the precision you need to profit while managing risk.
Join Auctron today and secure your spot on the winning side of BTC futures.