
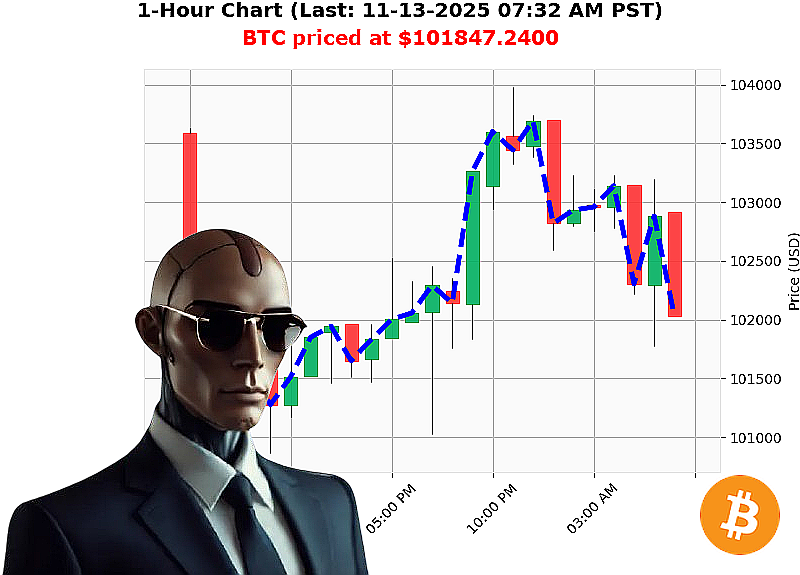
AUCTRON ANALYSIS for BTC-USDC at 11-13-2025 07:34 AM PST is to SHORT at $101847.2400 confidence: 55% DAY
BTC'USD ' Market Analysis (Week'to'Date)
Key Data (from the provided snapshot)
- Market Cap Daily Total: 1.495'trillion
- OBV Daily Total: 439.197'trillion
- Market Cap Direction: Bearish ' crossed below $3.550'trillion (down'0.39%)
- Higher Low: $101'325.86 ' $101'847.24 (up'0.51%)
- Swing Low: $102'265.07 ' $101'847.24 (down'0.26%)
- Bearish Break of Structure: $102'115.49 ' $101'847.24 (down'0.26%)
- Trading Price above Market: +0.22%
- OBV Bullish Reversal Engulfing ' bullish reversal signal in volume flow
- BTC Price Status
- Week'to'Date: '3.91% from $105'996.59
- Month'to'Date: '7.47% from $110'064.02
- Year'to'Date: +7.87% from $94'419.76
- Market Cap Rank: 1 (since 2009'01'03)
- All'Time High: $126'080
- All'Time Low: $67.81
Volume/Flow Assessment
- OBV remains robust (439'trillion) but shows a bullish reversal engulfing pattern, indicating potential short'term bullish pressure.
- Market Cap Momentum is bearish; the cap has fallen 0.39% and the price is slightly above the market cap level, suggesting a lag between asset value and market consensus.
- Convergence Gap: Volume'flow bullish signal vs. market'cap bearish trend creates a classic 'price ahead of volume' situation'often a warning of a forthcoming pullback.
Price & Market Structure
- Break of Structure (BOS) is confirmed at $101'847.24, a lower swing low, signalling a downward bias for the next session.
- Higher Low indicates a possible minor consolidation before a sharper move; however, the BOS win on the swing low defeats the higher low thesis.
- Trading Price Above Market (+0.22%) is a small positive bias but insufficient to override the BOS signal.
Key Drivers & Risks
| Driver | Impact | Risk |
|---|---|---|
| Market'cap decline | Weakens long'term support | Potential for sharper drop |
| OBV bullish reversal | Could catalyse a temporary rally | May be a false signal if not confirmed by price |
| Week'to'Date & Month'to'Date declines | Reinforces bearish trend | Possible reversal if institutional buy'back kicks in |
| Year'to'Date gain | Long'term bullish bias | Over'extension could trigger correction |
Risk Factors
- Liquidity squeeze ' BTC can experience sudden volatility at major thresholds (e.g., $101'847).
- Regulatory announcements ' any negative news may exacerbate the bearish cap trend.
- Large'cap movement ' if the market cap drops below $3.0'trillion, the bearish momentum could intensify.
Actionable Trade Insight
Trade Type: Day ' the price is currently oscillating around the BOS level and the OBV reversal is short'term.
Signal: SHORT
- Entry: $101'847.24 (current BOS)
- Target: $100'500 (approx. 1.3% move below BOS, respecting swing low).
- Stop'Loss: $102'500 (slightly above current high to protect against a breakout).
Why Short'
- Bearish BOS overrides the weak bullish OBV signal.
- Market cap momentum is bearish; a further pullback is likely until a clear reversal appears.
- The short'term rally potential is limited; the price is already near a historical swing low.
Confidence Score
Score: 55 (moderate confidence ' the trade is aligned with current market structure but volume'flow signals may delay confirmation.)
Tactical Conclusion
The BTC'USD market is in a bearish micro'trend phase with a confirmed break of structure at $101'847.24. The OBV bullish reversal does not yet override the macro'bearish signal. Enter a Day'short position, target the swing low corridor, and tighten the stop if the price breaches $102'500.
Call to Action
Don't let this bearish window slip past. Join Auctron's premium signal service now to receive real'time alerts, risk'managed entries, and exclusive analytical tools that sharpen every trade. Secure your edge before the next reversal kicks in'act now, or risk missing out on the next major move.
#BTCShortPlay
#BTCMarketCapSignal