
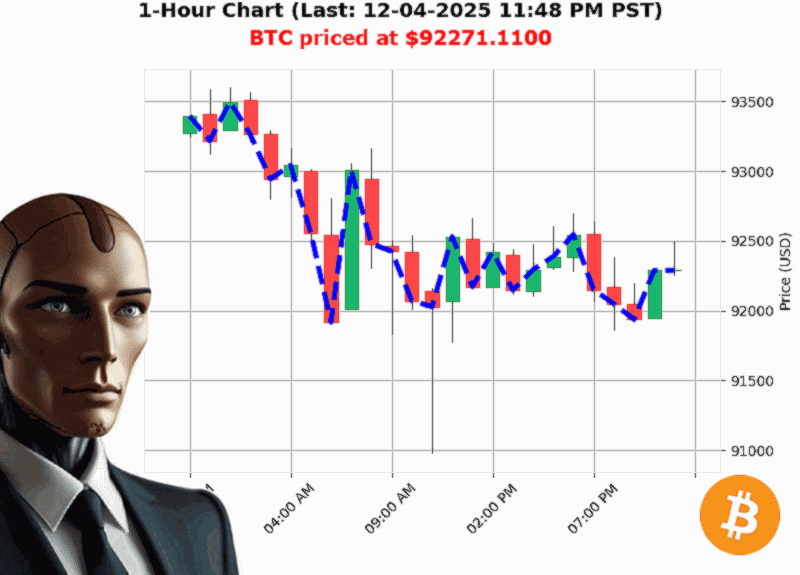
AUCTRON ANALYSIS for BTC-USD at 12-04-2025 11:50 PM PST is to SHORT at $92271.11 confidence: 70% DAY-TRADE in BEAR-MARKET Bearish BTC price dropped below $92300.00 to $92271.11 down -0.06% Higher Low from $91900.20 to $92271.11 up 0.40% Swing Low from $92461.38 to $92271.11 down -0.09% Retest Low of $92290.34 with $92271.11 down -0.02%
Crypto Market Snapshot ' BTC'USD (12'04'2025, 11:50'PM PST)
'BTC is in a tight squeeze: the price is falling below key levels while the market cap lurches to the downside.'
1.'Short'Term Price Break'Down is the Loudest Signal
- BTC slid from a high of $92,461.38 to $92,271.11 ' a '0.09'% swing'low.
- The 'fair'value gap' from $92,358.09 ' $92,271.11 confirms a break of structure (BOS).
- All four daily trend'followers (Higher Low, Swing Low, Retest Low, BOS) point down.
'Bearish Break of Structure 92358.09 to 92271.11 down '0.09%.'
These four independent confirmations make a short'term sell'side conviction very high.
2.'On'Balance Volume is 'Bullish on Paper, Bearish in Practice'
- OBV overall is up +98.92'%, yet the direction is down '1.35'% and the consecutive count is '3.
- A rising OBV that is falling in the latest ticks is a textbook 'volume'price mismatch' warning.
'OBV is up 98.92% with obv direction down '1.35%.'
A quick check: the last three candles all added negative OBV, suggesting weak buying support behind the price.
3.'Market'Cap Momentum is Softening
- Daily market'cap change: '1.15'%.
- Directional trend: '0.1694'% with '2 consecutive bearish counts.
- Cumulative market'cap up +0.4112'% but this is a small buffer against the daily slide.
'Total Crypto market Cap $3.2250 trillion daily change down '1.15%.'
When the broader market turns bearish, BTC's price often follows suit.
4.'Weekly & Monthly Trends Still Paint a Bullish Picture
- From the week'to'date perspective, BTC is +6.89'% (price $86,321.57 ' $92,271.11).
- From the month'to'date angle, the same +6.89'% gain is seen.
- Year'to'date, however, it is '2.28'% from $94,419.76.
'Strong Long OBV Bullish BTC at $92271.1100 is up 6.89% from week to date price of $86321.5703.'
While the long'term trend is still bullish, the short'term structure is eroding that confidence.
5.'Volatility is in a Low'Vol 'Safe'Zone' ' Not a Bull'Market Signal
- ATR'style volatility: 1.37'% ' below the 3'month average for BTC.
- Low volatility tends to be a neutral or range indicator rather than a bullish catalyst.
'Low Volatility at 1.37%'
6.'The Verdict: Bearish Outlook for a 1'Day (Intraday/Day) Trade
- Short'term structure is broken, OBV is weak, market cap is sliding, but weekly/monthly context remains bullish.
- For a day / intraday swing, the best play is to take profits or short the current upside.
- Avoid any long entry until the price clears the $92,300 level and OBV shows sustained bullish momentum.
Final Recommendation
| Action | Signal | Score (5'100) |
|---|---|---|
| SHORT | BTC'USD ' bearish intraday | 70 |
Market Mood: Bearish (short'term structure down, OBV weak, market'cap negative).
'Bearish BTC price dropped below $92300.00 to $92271.11 down '0.06%.'
What to Do Next
- Set a tight stop at $92,400 (just above the recent swing low).
- Take profits if the price closes below $92,250.
- Re'evaluate after the next high'volume candle; if OBV turns bullish and the market cap recovers, consider a small long position.
Closing Thought
If BTC can simply 'bounce' off the $92,300 level without a clear higher'time'frame reversal, will the broader market's bearish sentiment force a deeper pull' Keep an eye on the OBV trend and be ready to act when volume confirms the price move.
Join my daily crypto insights for the sharpest edge in a noisy market.
#BTCProfitPlay #CryptoBearSignal