
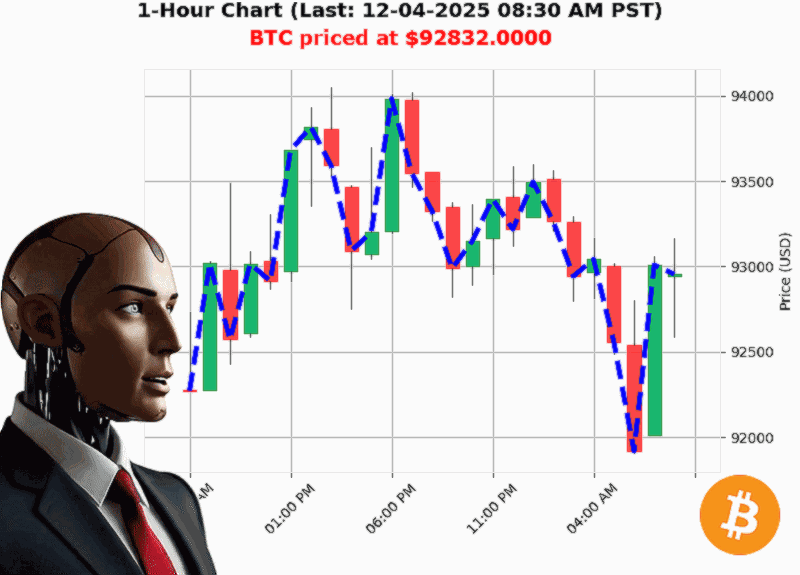
AUCTRON ANALYSIS for BTC-USD at 12-04-2025 08:33 AM PST is to BUY at $92832.00 confidence: 70% DAY-TRADE in BULL-MARKET Higher Low from $91909.18 to $92832.00 up 1.00% Swing Low from $93003.02 to $92832.00 down -0.15% Retest Low of $92788.70 with $92832.00 down +0.05%
** Prediction Summary
| Trade Type | Signal | Confidence (5'100) | Market |
|------------|--------|---------------------|--------|
| DAY (Intraday) | BUY | 70 | BULL** |
A bullish week'to'date move and a rising market'cap signal a short'term buy, despite a modest daily pullback.
Bitcoin Surprises with a Bullish Week Amid Daily Pullback
Bitcoin is currently priced at $92,832, down '0.68% from the open. Yet it is up 7.54% for the week from $86,321.
The price's daily decline is shallow, and the broader week'to'date momentum remains firmly bullish. This contrast shows that Bitcoin is simply re'testing lower territory while still riding a longer'term up'trend.
'Bullish BTC at $92,832 is up 7.54% from week to date price of $86,321.57.'
Market Cap Surges Past $3.25 Trillion: A Bullish Signal
The total crypto market cap has just crossed $3.256 trillion, up 1.17% on the day.
A rising cap indicates that institutional and retail capital is still flowing into the market. The fact that the cap has crossed a psychologically significant threshold (the 3.25'trillion mark) reinforces a bullish bias for the near term.
'Market Cap Direction Bullish Crossed above 3.250 at 3.256 trillion up 0.18%.'
OBV's Volatility: Volume Woes But Cumulative Bullishness
On'Balance Volume (OBV) is down '81.89% with a negative direction of '0.31%. However, OBV has a cumulative bullish count of +16 and a cumulative OBV total of +$38.8'k.
Short'term volume weakness could signal a pause, but the cumulative OBV trend is still positive. This dichotomy suggests that volume is temporarily dragging, but underlying buying pressure remains intact.
'OBV cumulative count up +16 and cumulative obv total up +38.8007.'
Higher Low Holds Firm: Support at $92,832
Bitcoin's higher low is at $92,832, which is $923 above the previous low of $91,909.
A higher low is a classic bullish sign, indicating that buyers are stepping in at progressively stronger levels. The current price sits neatly at this higher low, providing solid intraday support.
'Higher Low from $91,909.18 to $92,832.00 up 1.00%.'
Bearish Fair Value Gap: A Minor Setback
A small bearish fair'value gap exists between $92,954 and $92,971, down '0.15%.
While the gap signals a brief period of selling pressure, its narrow width and the overall bullish structure mean it is unlikely to block a retracement. Traders may watch this area for a short'term dip before the price rebounds.
'Bearish Fair Value Gap from $92,954.12 to $92,971.69 down -0.15%.'
Short'Term Outlook: Day Trade Buy Signal
Combining the bullish week, rising market cap, higher'low support, and cumulative OBV positivity, the best intraday approach is a BUY.
The price may dip to the $92,700'$92,800 zone (the current swing low), but it should find support at the higher low and potentially rally back towards $93,200'$93,500. A tight stop below $92,600 protects against a sharp reversal.
'Bearish Break of Structure 92,971.69 to 92,832.00 down -0.15%.'
Final Thought
Bitcoin's daily pullback may look like a correction, but the underlying trend, market cap strength, and volume narrative keep the market bullish. Will the price break the higher low or bounce back' The next few hours will decide.
Call to Action
Want to stay ahead of the curve' Join my premium analytics service for real'time signals, in'depth analysis, and exclusive market insights'before you miss the next big move.