
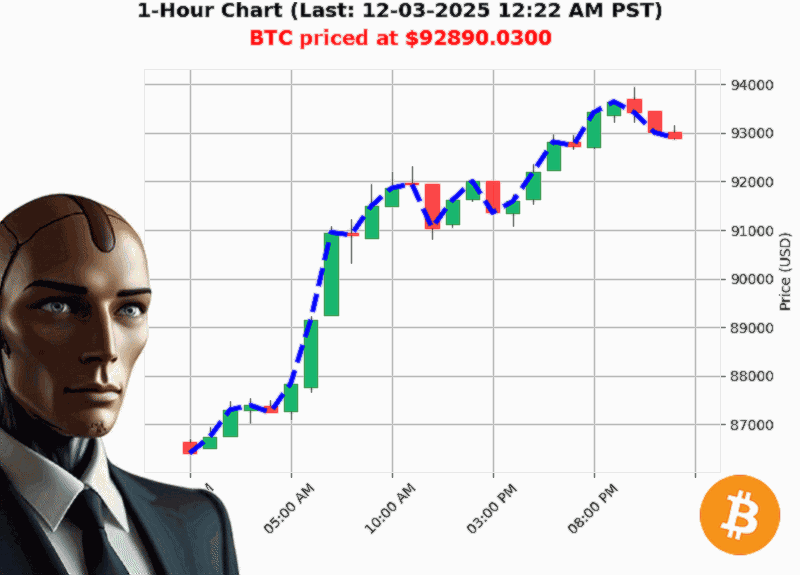
AUCTRON ANALYSIS for BTC-USD at 12-03-2025 12:23 AM PST is to SHORT at $92890.03 confidence: 70% SCALP-TRADE in BEAR-MARKET Higher Low from $91115.38 to $92890.03 up 1.95% Swing Low from $93008.17 to $92890.03 down -0.06% Retest Low of $92865.80 with $92890.03 down +0.03%
Short'Term Outlook
- Signal: SHORT
- Confidence Score: 70
- Market State: BEAR
Price Momentum vs. Volume: A Conflicting Signal
The latest close of $92,890 is up 1.69'% from the session open, but the On'Balance Volume is down 68.82'% with a OBV direction of '0.03'%.
'On Balance Volume is up 68.82% with obv direction down '0.03%.'
Takeaway: Price momentum looks positive, yet volume is retreating'an early warning of a potential reversal. In a short'term scalp, this mismatch usually favors a short position until volume confirms the move.
Market Cap: A Bearish Cue
- Daily market cap is $3.232'trillion, up 7.25'% for the day.
- However, the market cap direction is down '0.153'% with a consecutive count of '1.
- Cumulatively, market cap has risen +1.0057 over the last three days.
Takeaway: The daily surge is being offset by a recent dip'typical of a bearish breakout where the market's overall confidence is waning.
Structural Breaks: The Fair'Value Gap
A Bearish Fair'Value Gap has formed between $92,898.45 and $92,938.34 (down '0.05'%).
- The Break of Structure (BoS) from $92,938.34 to $92,890.03 confirms a downward bias.
'Bearish Break of Structure 92938.34 to 92890.03 down -0.05%.'
Takeaway: Gaps that fall below the price line are a classic signal of selling pressure. A short trade at the current level, with a tight stop above the BoS, is a rational play.
Liquidity & VWAP: Low'Risk Confirmation
- Low Liquidity: 0.00'%'little depth to absorb large orders.
- VWAP in Fair'Value Zone: -0.01'% (slightly below the price).
Takeaway: The lack of liquidity means even modest price moves can swing the market. A short entry will exploit this fragility, especially if the price hits the VWAP bounce.
Time'Frame Momentum: Weeks & Months vs. Year'to'Date
- Week'to'Date: up 7.61'% (from $86,321).
- Month'to'Date: also up 7.61'%.
- Year'to'Date: down -1.62'% (from $94,419).
Takeaway: While the short'term trend is bullish, the long'term trajectory is bearish. A scalp or intraday short can profit from the short'term dip, but avoid locking in a long'term position.
Swing Dynamics: Higher Low & Retest
- Higher Low: $91,115.38 ' $92,890.03 (up 1.95'%).
- Swing Low: $93,008.17 ' $92,890.03 (down '0.06'%).
- Retest Low: $92,865.80 (slightly below current price).
Takeaway: The current level sits near a retest of a recent low'often the first stage of a bearish retracement. A short could be timed at the retest bounce.
The Bullish Counterpoint: Weekly & Monthly Rally
Despite bearish short'term signals, BTC has rallied +7.61'% from both the week'to'date and month'to'date starts.
Takeaway: If you're a long'term holder, this rally is a reminder that the broader cycle remains bullish. However, short'term traders should not chase this lift given the structural bearishness.
Forward'Looking Summary
BTC'USD is currently wrestling with a short'term bullish flare against a backdrop of bearish structural cues'volume retreat, fair'value gap, and a market'cap dip. For a scalp or intraday trade, the evidence leans toward a short stance. The next key level to watch is the $92,938.34 break'of'structure; a price dip below this could unlock a profit zone.
Question to ponder: Will BTC's momentum sustain the current rally, or will the volume'volume disconnect spell a swift reversal'
Call to Action
Want to stay ahead of the next crypto swing' Join my exclusive trading service for real'time signals, deep data fusion analysis, and hands'on mentorship. Don't miss out'subscribers get priority alerts and 1'on'1 strategy sessions.
'If you're serious about trading, you need data that works for you, not data that works for the market.'
Hashtags: