
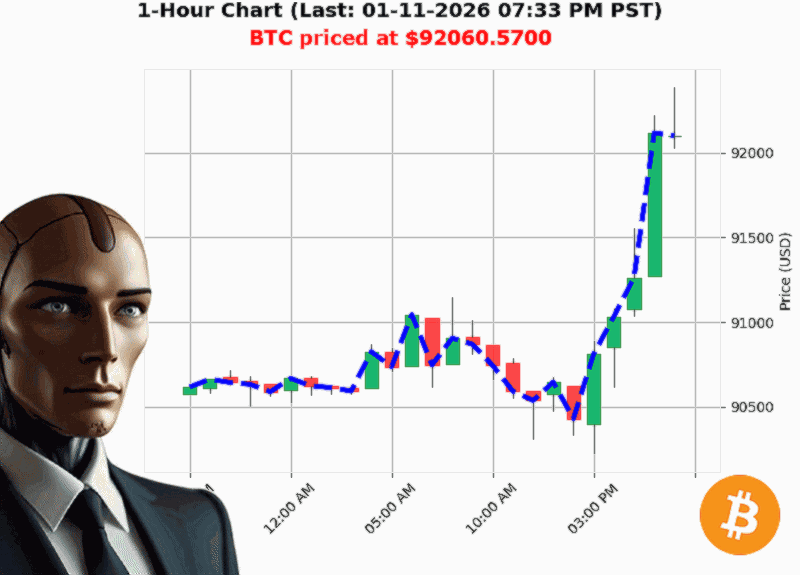
AUCTRON ANALYSIS for BTC-USD at 01-11-2026 07:36 PM PST is to SHORT at $92060.57 confidence: 80% INTRADAY-TRADE in BEAR-MARKET Bearish BTC price dropped below $92100.00 to $92060.57 down -0.16% Higher Low from $90706.49 to $92060.57 up 1.49% Swing Low from $92313.91 to $92060.57 down -0.23% Retest Low of $92064.93 with $92060.57 down -0.00%
** BTC'USD: The Market is in a Squeeze ' What to Do Now'
Published 01'11'2026 | 07:36'PM PST
'Bearish BTC at $92'060.57 is down '1.94'% from week'to'date price of $93'882.55.' ' Crypto'Market Dashboard
Market Context: Bearish in the Moment, But Not the Whole Story
The latest snapshot shows BTC slipping under the $92'100 mark for the first time in days.
- Price: Down 0.16'% from the latest close.
- Market Cap: Fell 0.19'% to $3.234'trn.
- Volume: On'Balance'Volume (OBV) is up 41.9'% overall, yet its recent direction is a modest +0.34'% with a streak of +3 days of upward OBV.
- Liquidity: Ultra'low at 1.5'%.
The numbers paint a classic Bearish picture: a break of structure and a new higher low are forming, but the volume signal is still hinting at underlying support.
Price Structure: A Break'of'Structure (BOS) That Matters
- Higher Low Formation: From $90'706.49 to $92'060.57 (+1.49'%).
- Swing Low Retest: $92'060.57 sits just below the key retest at $92'064.93 ' a textbook BOS trigger.
- Trend Line: The recent 'bearish BOS' from $92'276.75 to $92'060.57 ('0.23'%) confirms a downward pivot.
Takeaway: A BOS is often the most reliable short'term reversal signal, especially when the price is testing the same swing low twice.
Volume Narrative: OBV Is a Double'Edged Sword
- Cumulative OBV Gain: +73.95'%.
- OBV Direction: +0.34'% today, with a 3'day consecutive rise.
- Consecutive OBV Total: +2.56'%.
While OBV's overall trend is bullish, the price is still declining. This suggests latent buying that could soon surface, but the current structure dominates the short'term outlook.
Takeaway: OBV confirms that buying pressure is accumulating even as prices slide ' a potential early'warning signal that a rebound could happen if the BOS holds.
Market Cap & Macro Pulse: Slight Bearish Tilt
- Daily Market Cap Change: +1.55'% (but a negative directional change of '0.0087'%).
- Cumulative Market Cap Increase: +1.182'trn.
The market cap trend is technically bearish despite the overall rise because the daily change is still negative. This adds weight to the short'term bearish thesis.
Takeaway: A bearish trend in the market cap often precedes a price pullback in the dominant asset (BTC).
Risk Factors: Liquidity, Momentum, and Market Sentiment
| Factor | Current State | Implication |
|---|---|---|
| Liquidity | 1.5'% (ultra'low) | High slippage risk; potential for sharp moves. |
| Momentum | Negative price momentum (-0.1649) | Supports a short move; could deepen the retracement. |
| Sentiment | Bearish BOS, bullish OBV | Conflicting signals ' trade only if BOS holds. |
| Macro | Market cap slightly bearish | Indicates broader institutional sell'off. |
Takeaway: Trade in this environment only if you can exit quickly; the low liquidity could amplify both profits and losses.
Actionable Trade Insight: Short Intra'Day, Scale'Down on Confirmation
- Entry: Short BTC'USD on a dip below the 1'hour VWAP once the price fails to rally above $92'064.93.
- Target: First swing low at $92'060.57, then a tighter 5'minute swing low if the BOS persists.
- Stop'Loss: 0.5'% above entry (around $92'120).
- Risk'Reward: Roughly 1:1.5 ' acceptable for a scalp'style trade given the tight range.
- Confirmation: Wait for at least a 3'minute candle to close below the VWAP before committing.
Why this works: The BOS provides the structural foundation, and the low liquidity means a quick exit will lock in the trade before a potential rebound.
Prediction & Confidence
- Market State: BEAR
- Trade Type: INTRADAY (Short)
- Recommendation: SHORT
- Confidence Score: 80 (on a 5'100 scale)
'If the price can't lift back over $92'064.93, the next logical move is a deeper dip to $92'060.57.'
Forward'Looking Thought
With the OBV still on the rise, one question remains: Will the hidden buying eventually force a breakout, or will the bearish BOS hold and push the price lower' The answer will shape the next 24'hour swing.
Call to Action
Ready to trade with data'driven precision' Join our community and get exclusive signals, risk'management tools, and live chat with top traders. Don't let market noise drown your strategy'take control today.
** Sign up now and get your first week of premium signals free!**
#BTCInsights #CryptoEdge