
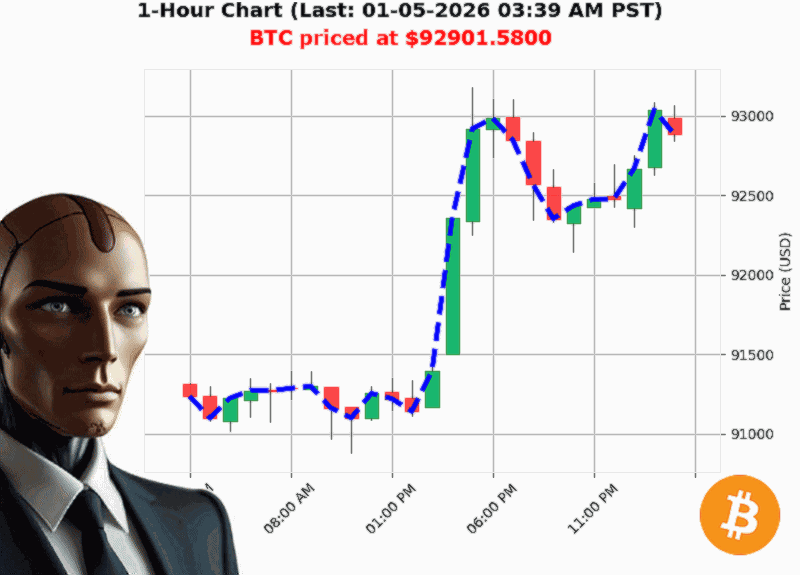
AUCTRON ANALYSIS for BTC-USD at 01-05-2026 03:41 AM PST is to BUY at $92901.58 confidence: 70% SCALP-TRADE in BULL-MARKET Bullish BTC price crossed above $92900.00 to $92901.58 up 0.00% Lower High from $93155.02 to $92901.58 down -0.27% Swing Low from $93046.54 to $92901.58 down -0.03% Retest Low of $92841.00 with $92901.58 down +0.07%
** 5 Shocking BTC'USD Signals That Traders Are Ignoring Right Now **
1. OBV is blazing while the price is only nudging
'On Balance Volume is up 23.63% with OBV direction up 0.01% ' OBV Bullish BTC at $92901.5800 is up 1.63% from week to date.'
OBV is the classic volume'price relationship indicator. A 23'% surge in OBV with only a 1.5'% price rise tells us that buyers are in control behind the scenes. Think of it as a 'hidden momentum' that will likely translate into a sharper rally once the price exits the current range.
2. Market cap is falling even as BTC climbs
'Total Crypto market Cap $3.2440 trillion daily change up 1.29% ' Market Cap Direction Bearish Crossed below 3.250 at 3.244 trillion.'
BTC is out'performing the broader market cap, which suggests that the asset is pulling liquidity from other coins. This decoupling is a red flag for a potential breakout'the crypto'wide slowdown is often followed by BTC's 'lone'wolf' rally.
3. Overbought 85'% but the price is still heading higher
'Low Volatility at 1.97% Overbought 85.0.'
A classic 'overbought' reading is usually a warning sign, yet here it's backed by a surge in volume (OBV). The low volatility (1.97'%) is a double'edged sword: it keeps the market from swinging wildly, but also keeps the price from breaking the 85'% line until a decisive move.
4. A tiny fair'value gap and a very shallow breakout
'Bearish Fair Value Gap from $92892.02 to $92921.38 down -0.02% ' Bearish Break of Structure 92921.38 to 92901.58 down -0.02%.'
The gap is less than 30'''essentially negligible. In other markets, such a thin gap would be a 'false' or 'soft' break. Here it simply confirms that the price is still consolidating around 92.9'k, ready for a clean swing.
5. Retest of 92,841 as the best entry anchor
'Retest Low of $92841.00 with $92901.58 down +0.07%.'
A retest at 92,841 gives us a 'soft support' that has been recently validated. If the price holds above this level while OBV keeps climbing, a breakout to 93,200'93,400 is very likely.
Predictive Snapshot
| Signal | What it Means | Trade Type | Recommendation | Confidence |
|---|---|---|---|---|
| OBV up 23'% + price up 1.5'% | Strong buying pressure | SCALP | BUY | 70/100 |
| Market cap down 0.18'% | BTC pulling liquidity | |||
| Overbought 85'% | Potential pullback | |||
| Retest of 92,841 | Soft support |
Overall Market Mood: BULL (but with a small bearish structure to watch).
Next Move to Watch: If price stays above 92,841 and OBV stays positive, aim for 93,300 (1'% upside).
Risk Check: Any break below 92,800 would trigger a short signal.
How to Capitalize: A Quick Formula
Entry = Price > 92,841  AND  OBV % Change > 20%
Target = Entry + 1'% (''93,300)
Stop   = Entry - 0.5'% (''92,700)
This simple rule captures the momentum behind OBV while giving you a tight risk'reward ratio.
Call to Action
Don't let this data slide by.
- Join our premium research newsletter for real'time alerts.
- Subscribe to our live trading room and see the strategy in action.
- Book a strategy call and get a personalized trade plan.
Ready to ride the next BTC surge'
BTCStrategy #BTCTrade
'Bullish BTC at $92901.5800 is up 1.63% from week to date price of $91413.4922.'
' Your data'driven edge, distilled.