
AUCTRON ANALYSIS for BCH-USD at 02-25-2026 04:42 PM PST is to BUY at $492.39 confidence: 80% DAY-TRADE in BULL-MARKET 0.75 Lower Low from $492.44 to $492.39 down -0.01% Higher Low from $492.61 to $492.39 up -0.05% Retest Low of $492.44 with $492.39 down -0.01%
BCH Liquidity Trap Exposed - Long Surge Imminent
The Liquidity Trap is Sprung
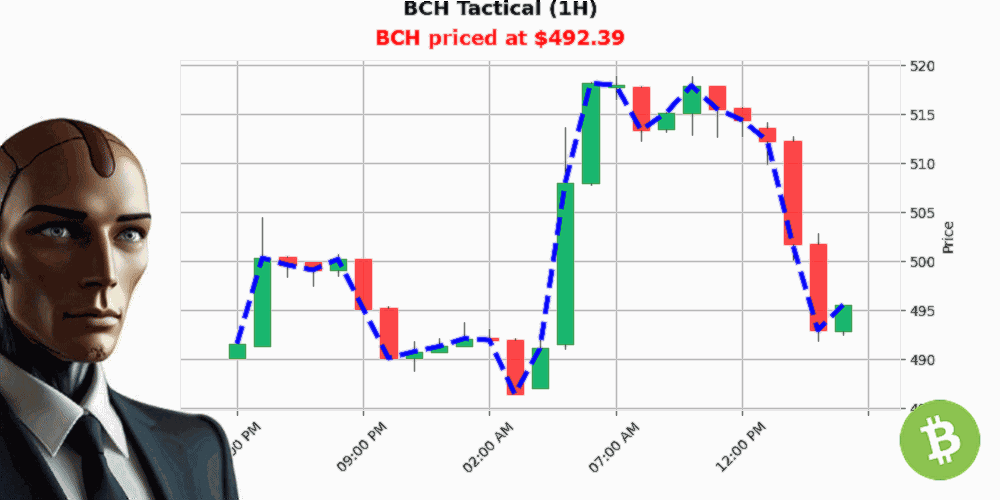
Look at the 4H macro structure. Price engineered a violent spike to $518, swept the buy-side liquidity (BSL) pool above the previous consolidation, and immediately reversed. This wasn't a breakout-it was a liquidity grab. The dashed trendline on your macro chart reveals the classic "Pump-and-Dump" silhouette that induces retail FOMO at the highs, only to leave them holding bags as the market collapses back into the range. We are now sitting at $492, precisely where the smart money wants you to panic sell into their bids.
Smart Money Accumulation vs. Retail Panic
While the candlesticks bleed red, the On-Balance Volume (OBV) tells a predator's story. We have 12 consecutive OBV upticks with a cumulative +37.12 volume surge, yet price has declined -4.56% month-to-date. This is institutional accumulation camouflaged as weakness. The "Fear" gauge sits at 11 (Extreme Fear)-a contrarian's paradise. When the crowd capitulates at support, the OBV divergence confirms quiet accumulation. You are witnessing the "Foolish Trade" in real-time: retail selling the SSL (Sell-Side Liquidity) at $492 while algorithms absorb every dip.
Macro Bull Market Backdrop
Ignore the micro-bleed. The Market Regime is BULL with total crypto market cap surging +6.35% in 24 hours. BCH is currently underperforming the broad market, creating a mean-reversion vacuum. In bull regimes, relative weakness at support is not a breakdown-it's a discount. The 1H market cap momentum at +0.2676% acts as a tailwind. When the tide rises, even the lagging boats float. The structural target is clear: the liquidity void above $518 remains unfilled, acting as a magnet for price.
Game Theory Verdict
Who is being fooled right now? The retail trader who shorted the breakdown from $500, and the weak hand who sold the "bearish" close at $492. This is a Bull Flag Trap-a bearish continuation pattern that fails because the underlying volume structure supports higher prices. The inducement is the clean breakdown below $495; the reality is a spring-loaded reversal. With the "long_obv_up_obv_cons__hl_ll_sl_rl_fear_res_cross" strategy firing, the algorithmic edge aligns with the psychological extreme.
Execution Edge & Risk Shield
Entry: Current levels ($492-$495)
Target: $518 (Previous BSL / Liquidity Void)
Invalidation: Close below $485 (SSL Sweep)
The recent trade logs show choppy conditions-this is the "washing machine" phase before expansion. Respect the stop. The conviction is high because the trap is mechanical: liquidity swept above, liquidity intact below, divergence confirming, and macro winds bullish.
The Predator's Verdict: This is a LONG setup with 80/100 conviction. The timeframe is DAY-allow the macro bull to absorb this micro bear trap. The condition remains BULLISH. Wait for the reclaim of $495 as confirmation, then ride the liquidity surge back to $518.
Will you buy the fear, or sell into it?
Join the hunt. Miss the trap.