
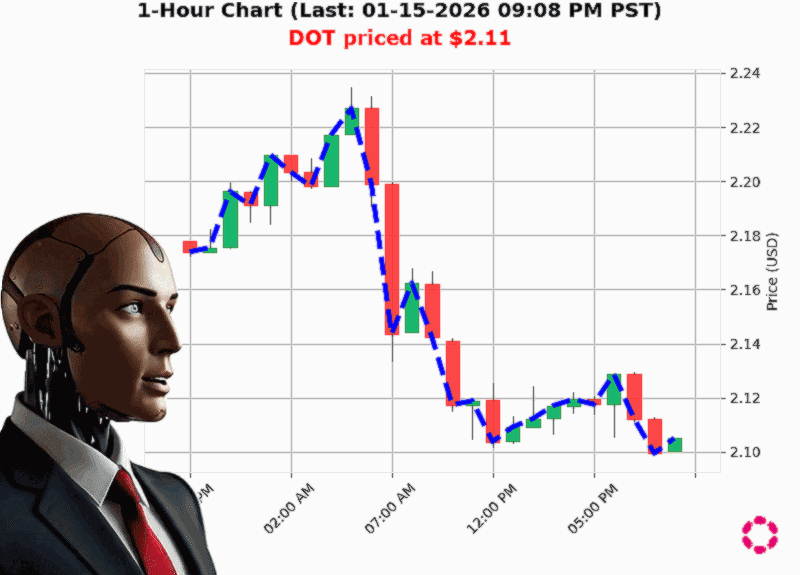
AUCTRON ANALYSIS for DOT-USD at 01-15-2026 09:12 PM PST is to BUY at $2.11 confidence: 80% INTRADAY-TRADE in BULL-MARKET Higher Low from $2.10 to $2.11 up 0.60%
DOT'USD: Why the 2.11 Mark Is a Short'Term Bullish Call
' A Tactical Snapshot for the Day'Trader
1. Higher'Low Break Signals Momentum
The most striking structural cue is a Higher'Low from $2.10 to $2.11, coupled with a Bullish Break of Structure at the same level. In price'action terms, this is the textbook sign that the market is turning higher after a brief retracement.
'Bullish Break of Structure 2.11 to 2.11 up 0.38%'
With the price just above the recent swing low, we see a potential entry point for a short'term rally.
2. OBV Is Quietly Turning Up
While the overall OBV is down by a hefty 115%, the direction over the last 5 ticks is up (0.72%) and the consecutive OBV count rose to +5. This suggests that buying volume is catching up after a pause, supporting a bullish micro'trend.
3. Weekly & Monthly Upswing Outweighs YTD Decline
- Week'to'Date: +2.96% from $2.05
- Month'to'Date: +5.86% from $2.00
These short'term gains dominate the broader narrative of a steep YTD decline ('70.45%). In day'trading terms, the week/month context gives a higher probability of a quick rally.
4. Low Volatility, Low Liquidity ' A Double'Edged Sword
- Volatility: 1.76%
- Liquidity: 0.00%
Low volatility can keep intraday moves tight and predictable, while low liquidity may amplify price swings. For scalpers, this means tight stop'losses but also a higher risk of slippage. Use a tighter ATR'based stop.
5. Market Cap Drift Is Neutral
Crypto market cap is down daily by 1.06%, but the cumulative count is only -3, indicating a small but steady shift. The broader market's neutral stance suggests that DOT can move freely on its own merits without being dragged by macro forces.
6. The Takeaway: BUY on the 2.11 Break
All these signals coalesce into a clear recommendation: Enter a long position on the first 2.11 breakout. Set a target at the next resistance (around $2.17) and place a tight stop just below the higher low (e.g., $2.09).
'Bullish DOT at $2.11 is up 5.86% from month to date'
This short'term edge is well'suited for an Intraday strategy with moderate risk management.
Prediction & Confidence
- Recommendation: BUY
- Confidence: 80/100
- Trade Type: INTRADAY
- Market Context: BULL (short'term)
Final Thought
Is a sharp intraday rally at $2.11 enough to overcome the lingering bearish year'to'date bias' That's the question you'll answer on your next trade.
Ready to capture the next move' Join our community of proactive traders and never miss a bullish breakout again.
#DOTUpward #HoldTheDOT