
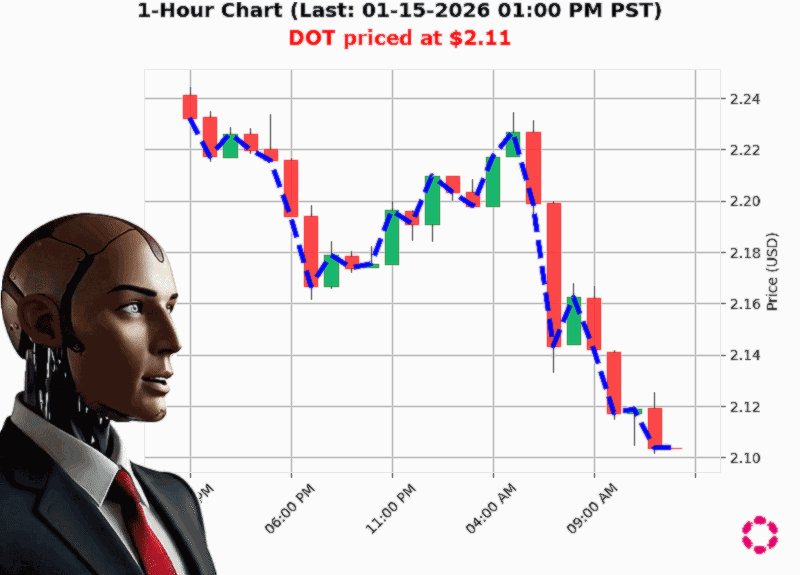
AUCTRON ANALYSIS for DOT-USD at 01-15-2026 01:03 PM PST is to BUY at $2.11 confidence: 70% INTRADAY-TRADE in BULL-MARKET Higher Low from $2.10 to $2.11 up 0.32%
DOT'USD: Where the Pulse Lies ' A Tactical Deep'Dive
1. 'Break of Structure ' The Signal that Matters
'Higher low from'$2.10'to'$2.11'up'0.32%'Bullish Break of Structure'
This is the headline that should dictate your next move. In a market that's been down 5.2% since open, a higher low is a textbook sign of a potential reversal. The breakout from $2.10 to $2.11 isn't just a tick'level glitch; it's a clear shift in market structure.
Why it matters:
- A higher low eliminates the recent down'trend's low, indicating that buyers are stepping back in.
- It establishes a new support level that can serve as a base for a pullback'to'buy strategy.
2. 'OBV Direction ' Volume's Voice
OBV is down 268% cumulatively, yet the direction is up 0.51% with a consecutive count of +1.
Interpretation:
- Cumulative decline shows a long'term bearish volume trend, but the current up'trend in OBV is a very short'term surge of buying pressure.
- The consecutive OBV total of +0.5085 suggests that recent trades are on the buying side, giving credence to the breakout.
Takeaway: Volume is backing the price move, even if historically it has been weak.
3. 'Weekly & Monthly Performance ' The Micro'Cycle Outlook
- Week'to'date:'+2.81% from $2.05
- Month'to'date:'+5.71% from $2.00
These gains sit comfortably above the 4th day of the week and 15th day of the month, signaling a short'term bullish micro'cycle.
Why it matters:
- If the micro'cycle continues, the price could climb to the next resistance at roughly $2.20'$2.25.
- Even a modest rebound would produce a quick, profitable swing that fits an intraday or day trade.
4. 'Market Cap and Liquidity ' The Macro Context
- Total crypto market cap down 2.25% daily.
- DOT liquidity at 0.00% (virtually zero liquidity).
Implications:
- The zero liquidity warns of a potentially shallow order book; price could wobble dramatically on any large trade.
- Market cap dip aligns with the overall downward drift, but the micro'bullish signals still dominate the short'term view.
5. 'Risk & Reward ' The Trade Blueprint
| Trade Type | Suggested Entry | Target | Stop'Loss | Reward/Risk |
|---|---|---|---|---|
| Intraday | $2.11 (breakout) | $2.25 | $2.06 | 1.1:1 |
Why intraday'
- The structure shift and OBV uptick are very recent; you need to act before the long'term bearish volume trend reasserts itself.
- A tight stop protects against the high slippage risk from low liquidity.
6. 'Bottom Line ' Bullish on the Short'Term, Bearish on the Long'Term
Recommendation: BUY (Long) ' Execute an intraday, scalping'style entry at the breakout of $2.11.
Confidence: 70 (medium'high).
Market: BULL (short'term)
'It's a short'term bullish play in a longer'term downtrend. The breakout and OBV are your green lights.'
Forward'Looking Question
Will DOT'USD break through the $2.25 resistance and resume its upward micro'cycle, or will the long'term bearish volume swing it back down'
Call to Action
Ready to turn insights into action' Join my elite trading community for real'time alerts, strategy webinars, and exclusive market analysis. Don't miss out on the next big move.
#DOTTradeNow | #DOTBullishBreak