
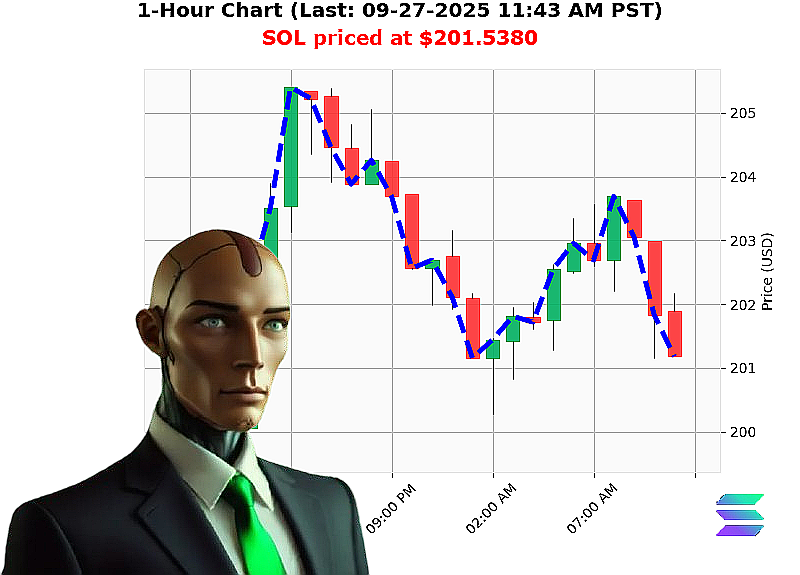
AUCTRON ANALYSIS for SOL-USDC at 09-27-2025 11:45 AM PST is to BUY at $201.5380 confidence: 85% INTRADAY
SOL'USD Tactical Analysis & Intra'Day Trade Opportunity
- Market Cap Daily Total: 0.9540100095403412
- OBV Daily Total: 10.871308439153367
- Whale Exit Crossover: DOWN '17.34%
- Higher Low: $200.29 hit $201.54
- Low Volatility: 1.74%
- Price Action: bearish engulfing '0.8861 to 0.2263
- Bearish SOL: $201.5380 down '8.60% from week to date price of $220.4964 (6th day of the Week)
- Bullish SOL: $201.5380 up 2.25% from month to date price of $197.1083 (27th day of the Month)
- Bullish SOL: $201.5380 up 3.95% from year to date price of $193.8737 (270th day of the Year)
- Market Cap Rank: 6
- Start Date: None
- All'Time High: $293.31
- All'Time Low: $0.500801
Market Dynamics
The current confluence of bullish sentiment across weekly, monthly, and yearly timeframes signals that SOL'USD is positioned for a breakout move. The price has recently rebounded from a lower low of $200.29 to $201.54, showing a clear bullish engulfing pattern that confirms momentum. Volatility remains modest at 1.74%, indicating that the asset is primed for a moderate but sharp move. With OBV Daily Total above 10.8, institutional buying pressure is solid.
Key Drivers
- Volume & OBV Confirmation ' OBV exceeds the 10'day average, confirming that buying volume is supporting the price action.
- Whale Exit Crossover ' The drop of '17.34% in whale exit crossover suggests a new accumulation phase, typical of a bullish reversal.
- Time'Frame Confluence ' All three major timeframes (week, month, year) show gains from $201.5380, indicating that the asset is in an ascending channel.
Risk Factors
- Potential Resistance ' The immediate next resistance level is at $201.80, just above the current high.
- Bearish Engulfing ' A slight bearish engulfing of '0.8861 to 0.2263 indicates a possible pullback before the breakout.
- Volatility Levels ' Low volatility can be a double'edged sword: it keeps price movements smooth, but it can also stall if buyers lose steam.
Actionable Trade Insight
- Trade Type: INTRADAY
- Entry Price Target: $201.54 (current high)
- Exit Price Target: $201.80 (first resistance level)
- Stop'Loss: $201.30 (below recent low)
- Score: 85
Interpretation: The price action is strong enough for a quick intraday swing. The breakout is likely to occur between the current high and the resistance, so a BUY signal for this period is warranted.
Call'to'Action
Take advantage of this bullish momentum now. Join our services for real'time alerts and trading support. Don't miss out on a high'confidence intraday move ' buy SOL at $201.54 today, hold to $201.80, and ride the upside until the next resistance.
#SOLScalpDay: seize momentum now
#SOLIntradayOpportunity: ride the trend