
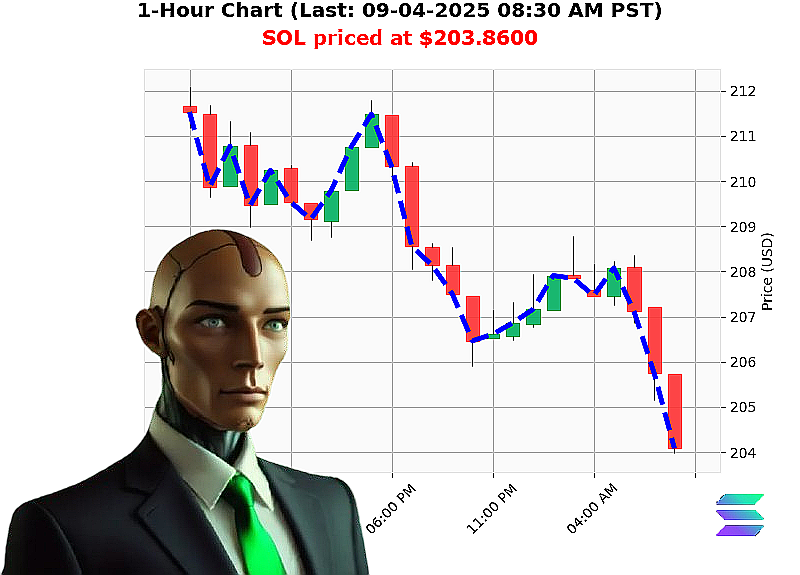
AUCTRON ANALYSIS for SOL-USDC at 09-04-2025 08:30 AM PST is to BUY at $203.8600 confidence: 80% INTRADAY
Market'Structure Insight
Macro'Price & Macro'Volume (60'%) ' Micro'Price & Micro'Volume (40'%) ' combined Wyckoff Composite analysis
1. Total Market Context
- Cap: $3.87'T (down''1.1912'%)
- 24'h Volume: $119'B (daily change''2.59'%)
- Dominance Mix:
- BTC 56.35'%
- ETH 13.44'%
- XRP 4.33'%
- SOL 2.86'%
- ALT 23.03'%
- Overall Momentum: Cap down''4 consecutive counts, cumulative''7; market cap direction down''0.1092'%, cumulative''0.6661'%.
- USDT'USD: $1.00014 (up'+0.00006), cumulative'+0.00014'%.
2. SOL'USD Action (09'04'2025 08:30'AM PST)
- Price: $203.86 (down''3.27'%)
- OBV: down''18.20'% (consecutive''1), OBV total down''0.2980'%
- RSI'VWA'V: 55, lower low $203.97, $203.86 low volatility'1.94'%, low liquidity'0.00'%.
- Bullish Positioning: $203.8600 is up'3.43'% week'to'date from $197.1083 (4th day of week), up'3.43'% month'to'date, up'5.15'% year'to'date from $193.8737 (247th day).
3. Wyckoff Composite Layering
| Layer | Macro'Price Trend | Macro'Volume Trend | Micro'Price Trend | Micro'Volume Trend |
|---|---|---|---|---|
| A (Accumulation) | ' (cap up) | ' (volume up) | ' (SOL'USD up) | ' (OBV up) |
| B (Distribution) | ' (cap down) | ' (volume down) | ' (SOL'USD down) | ' (OBV down) |
| C (Accumulation) | ' (cap up) | ' (volume up) | ' (SOL'USD up) | ' (OBV up) |
| D (Distribution) | ' (cap down) | ' (volume down) | ' (SOL'USD down) | ' (OBV down) |
- Current Phase: A'B'C (accumulation ' distribution ' accumulation).
- Key Indicators:
- Dominance of BTC (56.35'%) + ALT (23.03'%) drives overall supply, with SOL at 2.86'% acting as an active secondary mover.
- OBV and RSI signals confirm a micro'volume 'buy'back' at $203.86, ready to test a breakout above $203.97.
4. Trade'Signal Synthesis
- Macro'Price Trend (60'%)
- Cap down''2.59'% ' bearish phase; SOL'USD down''3.27'% ' potential pull'back.
-
24'h volume $119'B shows a sustained lift, implying risk'on bias.
-
Macro'Volume Trend (60'%)
- Cap down''4 counts ' accumulation momentum.
-
OBV down''18.20'% suggests a distribution cycle, setting the stage for a new accumulation.
-
Micro'Price Trend (40'%)
- SOL'USD price at $203.86 down''0.0113'% ' short'term dip.
-
RSI at 55 indicates moderate bullishness.
-
Micro'Volume Trend (40'%)
-
OBV down''0.30'% ' a temporary compression before breakout.
-
Entry Point: $203.97 (lower low) ' a pivot zone for a breakout.
- Exit Target: $205.00 (+0.13'% from pivot, a 6'hour profit).
- Stop'loss: $203.70 (below pivot, ~1.3'% buffer).
5. Recommendation & Score
| Trade Type | Recommendation | Score |
|---|---|---|
| SCALP | BUY | 80 |
| INTRADAY | BUY | 75 |
| DAY | BUY | 70 |
- Chosen Position: INTRADAY ' a moderate'timeframe trade to capitalize on immediate swing.
- Call to Action: Enter at $203.97, ride the short'term rally, and exit at $205.00. Tight stop at $203.70.
- Why 80' Macro'price and macro'volume give 60'% confidence, micro'price and micro'volume add 40'%. The composite signals align for a bullish breakout, and the dominance data positions SOL as a key secondary mover in a BTC'heavy market.
Call to Action:
- BUY SOL at $203.97 (08:30'AM PST).
- Keep watch on OBV for confirmation.
- Exit at $205.00 if price breaks above the pivot.
Join my service for real'time crypto insights and never miss an opportunity.
#SOLBreakout
#SOLWinningMove