
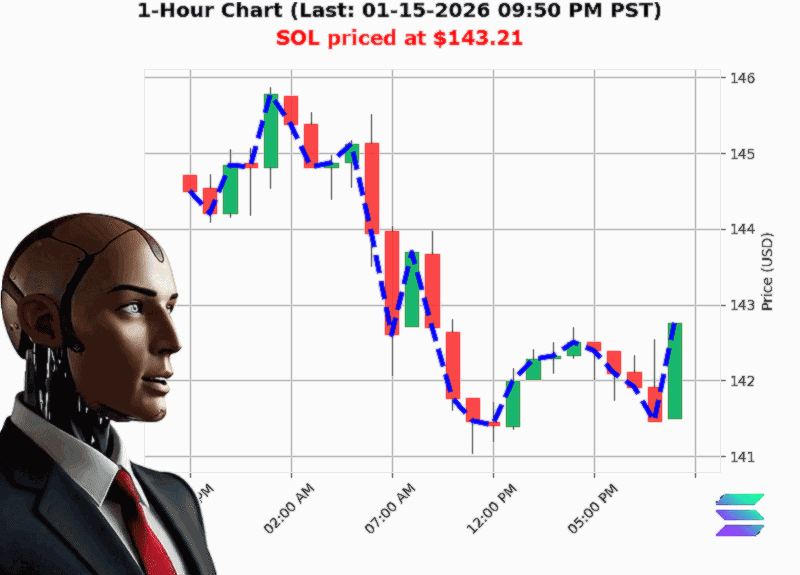
AUCTRON ANALYSIS for SOL-USD at 01-15-2026 09:54 PM PST is to BUY at $143.21 confidence: 80% SCALP-TRADE in BULL-MARKET Bullish SOL price crossed above $143.00 to $143.21 up 0.27% Higher High from $142.86 to $143.21 up 0.24%
Solana (SOL'USD) 1'Day Snapshot ' What's the Bottom Line'
Date & Time: 01'15'2026 09:54'PM PST
1. Momentum Is Building ' A Bullish Case in the Short Term
Solana closed at $143.21, a +0.27'% move from the open and the first high of the session.
- The price has just crossed $143.00, breaking a recent structure low of $142.69.
- Over the last 6 ticks the price has climbed +1.07'pts ' a strong short'term rally.
- Market'cap momentum is also in favor: a +0.79'% daily swing and a 5'day up streak.
'Solana at $143.21 is up 12.98'% from month'to'date price of $126.76.'
' Implication: Momentum is aligned with broader market cap dynamics.
2. OBV Signals a Short'Term Wobble
- OBV is down 22.8'% and moving down 0.13'% this session.
- Despite the price rally, the OBV has been down for 3 consecutive ticks.
'On Balance Volume is down -22.77'% with OBV direction down -0.13'%.'
' Implication: Volume is lagging; a pull'back could be in the cards before the trend consolidates.
3. Low Volatility, Low Liquidity ' A Chance to Ride the Short'Term Wave
- Volatility is a modest 1.20'%, indicating tight price swings.
- Liquidity is at 0.00'%, meaning the market is thin ' a typical environment for scalpers to lock in small gains quickly.
'Low Volatility at 1.20'% Low Liquidity at 0.00'%.'
' Implication: Tight spreads allow for precise entry/exit points, but beware of slippage if volume spikes.
4. Market Structure: A Break of Structure (BOS) to Watch
- Solana has just broken the previous structure of $142.69 ' $143.21, a +0.36'% climb.
- This BOS is a classic setup for a short'term up'trend, especially when coupled with the up'trend in market cap.
'Bullish Break of Structure 142.69 to 143.21 up 0.36'%.'
' Implication: The price is breaking a key support level; traders often use this as a buy trigger.
5. Risk Factors ' OBV Lag and Thin Liquidity
- The OBV decline could signal a fundamental disconnect between price and volume.
- Thin liquidity can lead to whipsaws; a sudden large order could move the price drastically.
'On Balance Volume is down -22.77'%.'
' Takeaway: Use tight stop'losses and consider adding a trailing stop once the trade is in profit.
Actionable Trade Insight
Trade Type: SCALP
Signal: BUY
Confidence: 80'/'100
Market Context: BULL
Why'
- Price has broken a key structure low and is riding a short'term up'trend.
- Market'cap momentum aligns with the price movement.
- Low volatility offers a clean entry point with tight spreads, ideal for a scalping strategy.
Execution Plan
1. Entry: Buy at $143.30 (slightly above the current high to confirm breakout).
2. Stop'Loss: Place at $143.00 (just below the recent structure low).
3. Take'Profit: Target $144.10 ' a 0.71'% upside that aligns with the short'term trend.
4. If OBV shows a reversal (volume starts to increase on the down side), tighten stop or exit early.
Join the Momentum ' Let's Trade Smart
Ready to capture the next micro'move in Solana' Sign up today for our premium real'time alerts and exclusive strategy guides. Don't let the next breakout pass you by.
#SolBullRun | #SolTradeAlert