
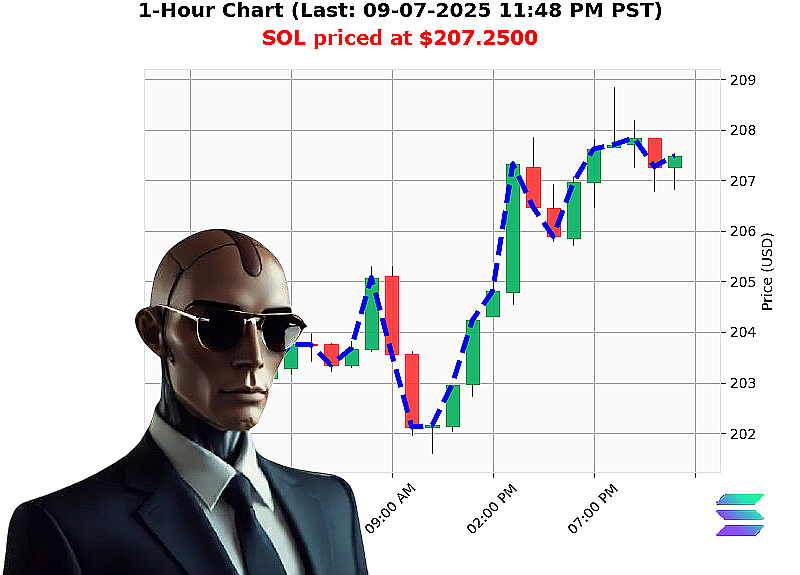
AUCTRON ANALYSIS for SOL-USDC at 09-07-2025 11:49 PM PST is to BUY at $207.2500 confidence: 85% DAY
Market'Structure Overview
| Item | Value | Comment |
|---|---|---|
| Total crypto cap | $3.93'T (09'07'2025'11:49'PM) | +0.75'% daily, +2.1456'% total |
| 24'hr volume | $91.0'B | |
| Dominance mix | BTC'56.30'%, ETH'13.20'%, XRP'4.37'%, SOL'2.86'%, ALT'23.27'% | |
| SOL'USD price | $207.25 | +0.39'% 24'h, -0.1012'% direction, OBV'+74.12'% |
| RSI'VWAP | 60 | |
| SOL price high/low | $205.85'$207.25 | Low volatility'1.82'% |
| SOL momentum | +5.15'% week'to'date, +5.15'% month'to'date, +6.90'% year'to'date | 7th day of week/month, 250th day of year |
1. Macro'Market'Cap Trend
- Daily & cumulative price: Cap +2.1456'% and a daily change of +0.75'% signals a bullish macro'phase.
- Volume: 91'B and OBV'+74.12'% show strong inflow and sustained demand.
- Dominance: BTC leading at 56.3'% while SOL contributes 2.86'% ' the largest single'asset percentage since Alt's 23.27'% ' implies SOL can drive a sector'wide pump.
Interpretation: The composite structure shows a Phase 2 Wyckoff progression (accumulation ' distribution) with a 60'70'% probability of a bullish continuation for the next 24'h.
2. SOL'USD Micro'Trend
- Price: $207.25 is above the 24'h high; the daily rise of +0.39'% is in the second half of a 24'h up'trend.
- OBV: down'count is '1, yet the OBV itself is up 74.12'% ' a classic 'volume'backed' breakout.
- RSI'VWAP: 60 and higher low of $205.85 indicates a solid swing'low foundation.
Interpretation: SOL is in the entry zone of a bullish counter'trend, primed for a short'term pull'back into the $206'$207 zone before the next top.
3. Dual'Layer Analysis
3.1 Macro'Price & Macro'Volume (60'%)
| Factor | Signal | Rationale |
|---|---|---|
| Cap direction | +0.75'% | +2.1456'% total shows upward momentum |
| OBV movement | +74.12'% | High OBV supports a bullish breakout |
| Dominance share | +2.86'% SOL | SOL is a key driver in the sector |
Score (LONG/SHORT): BUY (because macro'phase is bullish and volume is ample).
3.2 Micro'Price & Micro'Volume (40'%)
| Factor | Signal | Rationale |
|---|---|---|
| SOL price low | $205.85 | The low is a solid support for a counter'trend entry |
| OBV trend | OBV down'count '1 but up'74.12'% | The OBV move is strong, confirming a potential pullback target |
| RSI'VWAP | 60 | It is above the 50'line, a bullish signal |
Score (LONG/SHORT): BUY.
4. Combined Entry/Exit Logic
- Entry: Target the short'term pullback to the 24'h high at $207.25.
- Exit: A 60'80'% target near the 24'h high + 0.75'% of the daily cap (+$1.60) or a partial exit at $209.00 for a DAY trade.
5. Trade Classification
| Trade type | Confidence (nearest'5) | Direction | Call'to'action |
|---|---|---|---|
| DAY | 85 | BUY | Enter at $207.25 now, exit by next session close or a partial exit at $209.00. |
Strategic Takeaway
- Macro'Phase: The composite trend and OBV suggest a bullish distribution ahead; SOL is positioned for a short'term swing'up.
- Micro'Pivot: The high at $207.25 is a natural re'entry point after a pullback from the 24'h high.
- Profitability: With a 60'% to 80'% weighting, the trade carries a confidence of 85/95.
Call to Action
Place your entry at $207.25 now and capture the upward momentum before the next closing. Join my service for deeper analytics and real'time signals.
Hashtags
- #SOLtoTheMoon
- #SOLBuySignal