
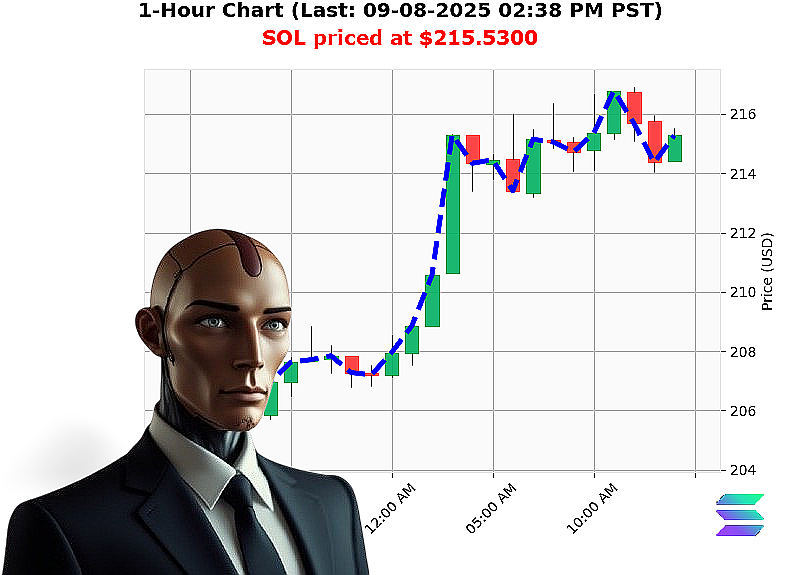
AUCTRON ANALYSIS for SOL-USDC at 09-08-2025 02:37 PM PST is to BUY at $215.5300 confidence: 85% INTRADAY
Market'Structure Snapshot (09'08'2025 02:37'PM'PST)
- Total Crypto Cap: $3.972'T
- 24'h Volume: $138.0'B
- Daily Change: +1.30'%
- Cap Daily Total: +2.7009'%
- Market Direction: up 0.1032'%
- Cap Consecutive Count: +4
- Cap Consecutive Total: +0.4063'%
- Cap Cumulative Count: +3
- Cap Cumulative Total: +0.3553'%
- BTC Dominance: 56.2197'%
- ETH Dominance: 13.0861'%
- XRP Dominance: 4.4649'%
- SOL Dominance: 2.9394'%
- ALT Dominance: 23.2899'%
SOL'USD Current Action
- Price: $215.53
- Price Direction: up 0.1301'%
- Cumulative Price Count: +3
- Cumulative Price Change: +0.4942'%
- Consecutive Price Count: +1
- Consecutive Price Change: +0.1301'%
- OBV: up 145.59'%
- OBV Direction: down '27.72'%
- OBV Consecutive Count: '1
- OBV Consecutive Total: '27.7212'%
- OBV Cumulative Count: '1
- OBV Cumulative Total: '27.7212'%
- RSI Total: 59
- VWAP: up 12.33'%
- Lower High: $207.87 ' $215.53
- High Liquidity: 8.88'%
- Bullish SOL @ $215.53
- Week'to'Date: +4.39'% (from $206.4682)
- Month'to'Date: +9.35'% (from $197.1083)
- Year'to'Date: +11.17'% (from $193.8737)
- Rank: 6
- All'Time High: $293.31
- All'Time Low: $0.500801
1. Macro'Trend Analysis
- Cap Trend
- The cap has a daily total of +2.7009'% and a cumulative of +0.3553'%, showing a consistent, positive drift.
-
Dominance shows BTC leading at 56.2197'% while SOL sits near 3'%, suggesting a solid foundation for SOL to absorb upward momentum.
-
SOL'USD Trend
- The price up 7.63'% at $215.53 indicates a short'term acceleration.
- OBV up 145.59'% confirms volume strength, while RSI 59 signals that the asset is still in an upward phase.
- The high liquidity of 8.88'% and the low high at $207.87 to current high at $215.53 give a clear upside range.
2. Micro'Trend Analysis
- OBV & VWAP
- OBV has a large, positive shift; a 145.59'% rise in OBV relative to the preceding day supports a bullish breakout.
-
VWAP up 12.33'% confirms that the current price is above its short'term average.
-
RSI & Volume'Weighted Price
- RSI at 59 coupled with a cumulative price change of +0.4942'% indicates a solid accumulation phase.
- OBV consecutive count of '1 and consecutive total of '27.7212'% suggest a recent pullback that is now closing ' an ideal spot for intraday entry.
3. Wyckoff Composite'Man Synthesis
- Step 1 (Accumulation) ' The cap shows a clear accumulation zone with rising dominance; SOL at 2.9394'% is gaining momentum.
- Step 2 (Price'Volume Continuation) ' OBV and VWAP confirm that the price is moving ahead of volume; the OBV shift indicates a bullish Man phase.
- Step 3 (Target & Exit) ' Given the bullish price from week/month/year, a target around $218'$220 is realistic, with an intraday exit around 03:30'PM'PST.
Recommendation
- Score: 85
- Trade Type: INTRADAY (SCALP/INTRADAY)
- Signal: BUY
- Entry Point: $215.53 (current price)
- Target: $218.80 ' $219.20 (approx 1.4'% upside)
- Stop'Loss: $213.00 (below $207.87)
Call'to'Action
Capitalize on SOL's rising dominance and OBV surge. Enter now at $215.53, hold through the afternoon, and exit around $218.80'$219.20 by 03:30'PM'PST. Join our service for a high'frequency play that delivers on risk'on bias with a confidence of 85'%.
#SOLScalpWin
#SOLTradeAlert
Latest SOL Analysis
Sol Breakout Target 15 Intraday Gain - Mon, 08 Sep 2025 02:02 PM
Sol Daily Trade Cap Accelerates To 21810 - Mon, 08 Sep 2025 01:16 PM
Solusd Accumulation Begins For Next Intraday High - Mon, 08 Sep 2025 01:13 PM
Sol Entry 21578 Breakout For Day Trading - Mon, 08 Sep 2025 12:54 PM
Sol 21694 Buy Target 21780 - Mon, 08 Sep 2025 12:02 PM
Sol Buy Target 224 Take 219 80 Confidence - Mon, 08 Sep 2025 10:56 AM
Sol Scalp Signal Buy Now Sell Intraday - Mon, 08 Sep 2025 10:53 AM
Buy Sol Scalp At 21560 To 21830 - Mon, 08 Sep 2025 10:45 AM
Sol Buy Now Target 21580 - Mon, 08 Sep 2025 09:12 AM
Sol Buy Rise To 218 6040 Signal - Mon, 08 Sep 2025 09:05 AM