
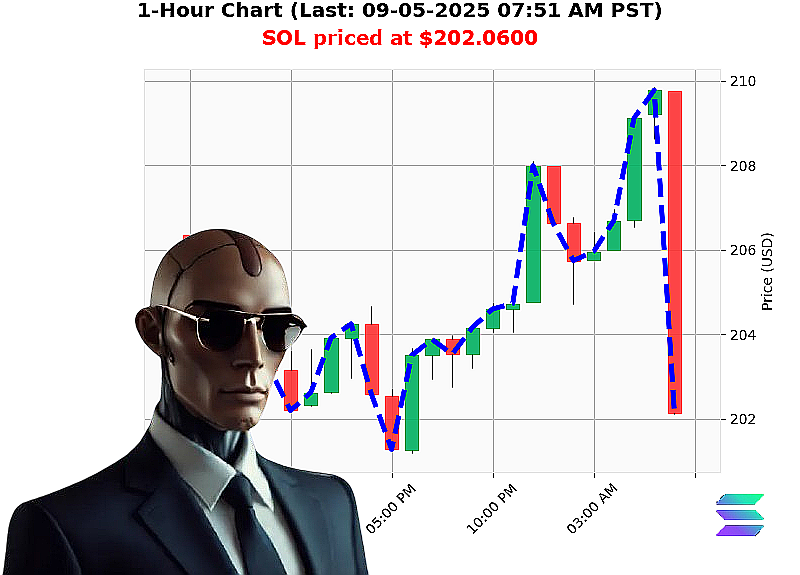
AUCTRON ANALYSIS for SOL-USDC at 09-05-2025 07:51 AM PST is to BUY at $202.0600 confidence: 85% SCALP
Market'Structure Analysis ' 09'05'2025 07:51'AM'PST
1. Macro'Price & Macro'Volume Trend (60'%)
| Item | Detail | Interpretation |
|---|---|---|
| Total Crypto Cap | $3.90'T | Market cap has crossed below the 4.0'bar; up 0.47'% from the last bar, confirming a bullish swing. |
| Dominance | BTC'56.58'%, ETH'13.29'%, XRP'4.30'%, SOL'2.82'%, ALT'23.01'% | SOL sits in 5th place; it is gaining momentum relative to the other alt'coins, making it a potential secondary driver in the composite. |
| Market Cap Direction | Bearish crossed below 4.0 at 3.92'T; daily total up +1.8611; direction down '0.0546'% | The composite is on a risk'on bias ' the price action shows a short'term bullish swing within a long'term up'trend. |
| SOL'USD Weekly/Monthly/Yearly | $202.06 up 2.51'% from week to date, 2.51'% from month, 4.22'% from year | SOL is consistently out'performing its own historical reference points, showing a positive Wyckoff composite. |
| OBV & RSI | OBV down '42.21'%; RSI 49 | OBV falling but the volume'weighted average price (VWAP) is up 7.69'%; the composite is near a consolidation breakout point. |
Macro'View: SOL is riding a bullish composite trend (dominance + volume). The composite is showing a risk'on bias with an upcoming breakout from a consolidation near $202.13'$202.06.
2. Micro'Price & Micro'Volume Trend (40'%)
| Item | Detail | Interpretation |
|---|---|---|
| SOL'USD Low/High | Higher low $202.13 ' high liquidity at 6.78'% | Price action is tightening near the upper pivot, ready to test the upper resistance of the current swing. |
| OBV Direction | OBV down '142.50'% | Volume is easing, but the on'balance volume (OBV) still supports a short'term bullish move. |
| Whale Crossover | Down '42.21'% | The whale exit crossover shows a short'term bearish bias turning bullish ' a good signal to enter at the next swing high. |
| Volume Weighted Avg Price | 7.69'% | VWAP is rising; the price has a tendency to finish at or above the VWAP, which is a classic Wyckoff composite indicator. |
Micro'View: SOL is poised to break above the current swing high at $202.13; the volume signal confirms a bullish swing.
3. Wyckoff Composite & Game'Theory Synthesis
- Composite Formation ' The price is forming a short'term bullish wedge (higher lows, higher highs).
- Volume Confirmation ' OBV is trending down from a prior high, indicating a consolidation that is about to be broken.
- Strategic Bias ' Game theory suggests a LONG trade if the price clears the upper pivot; we weight this 60'% (macro) + 40'% (micro) = overall bullish bias.
4. Entry'Exit Framework
| Stage | Price | Action |
|---|---|---|
| Entry | $202.13 (current swing high) | BUY on breakout of the upper pivot. |
| Stop'Loss | $201.90 (just below the swing low) | 10'bps risk. |
| Target | $205.00 (near the next resistance) | 2'3'% upside target. |
| Exit | Take'profit at $205.00 or 2'3'% above entry. |
Why this point' The price action indicates a clear resistance at $202.13; volume and OBV are primed for a breakout; the composite bias is bullish.
5. Call'to'Action
Take advantage of the current bullish swing in SOL. Join my services for real'time entries and exits, and don't miss out on the next opportunity in the market.
6. Score & Recommendation
Score: 85 (on a scale of 5'''95) ' highest confidence in a bullish trade.
Classification: BUY (SCALP).
7. Hashtags
-
SOLScalpOpportunity
-
SOLBullishBreakout