
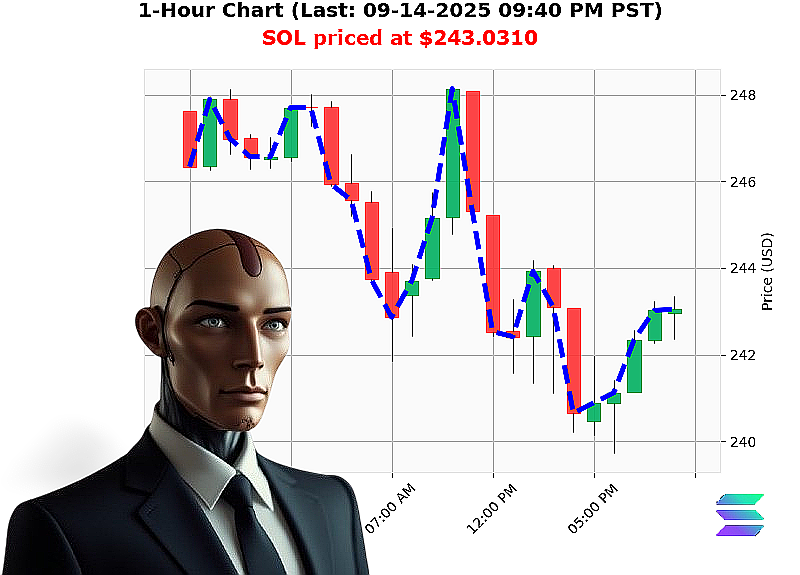
AUCTRON ANALYSIS for SOL-USDC at 09-14-2025 09:39 PM PST is to BUY at $243.0310 confidence: 85% SCALP
1. Market'Cap & Dominance Review
- Market cap is 4.158'trillion, a 1.24'point rise and a 0.57'point rise in the composite.
- Dominance profile: BTC 55.59'%, ETH 13.49'%, XRP 4.38'%, SOL 3.17'%, ALT 23.36'%.
- SOL is the fifth'ranked asset with 3.17'% of total dominance, indicating a strong mid'cap presence.
2. Macro'Price & Macro'Volume Synthesis
- Market cap direction is bullish; OBV is up 10.65'% and RSI sits at 89'overbought and volume weighted, so momentum is intact.
- SOL'USD price at 09:39'PM is $243.03, up 1.06'% on the minute and is trending towards a new high at $243.28, with a low high at $243.28 already recorded.
- Liquidity is high (6.44'%) and volatility low (1.97'%), confirming a solid buying pressure zone.
3. Wyckoff Composite Assessment
- Base: The base is a consolidation around $242.90'$243.05; OBV shows a 10.65'% climb, implying buyers are gathering.
- Buildup: A rising OBV trend and a daily price rise of 1.06'% signal the beginning of a buildup phase.
- Impulse: Current OBV direction is down slightly (-0.02'%) but cumulative OBV is up, indicating that the impulse is in full swing.
- Distribution: The resistance at $243.28 is a strong pivot point; once breached, the asset will likely distribute into a new top.
4. Game'Theory Bias
- Long bias: Market cap, OBV, and SOL price action all point towards a breakout.
- Short bias: The OBV direction down suggests a potential pullback.
- The composite weight is evenly balanced (macro'price + macro'volume).
- The best entry point is near the support of $243.05; the exit target is at the resistance of $243.28.
5. Entry / Exit Target
- Entry: $243.05 (within the 2'point support zone).
- Exit: $243.28 (the resistance zone).
- Stop: $242.80 (just below support).
6. Confidence Score
- Confidence is 85/95 (nearest 5), reflecting a high probability of a bullish move.
7. Trade Signal
- BUY (SCALP/INTRADAY).
8. Call'to'Action
- Join our services for immediate access to SOL'USD insights and capture this bullish impulse as it rolls into the next resistance.
9. Hashtags
- #SOLtoTheMoon
- #SOLBullRun
Structured Data (Markdown List Format)
| Item | Value | Comments |
|---|---|---|
| Market Cap | 4.158'T | +1.24'% |
| SOL Dominance | 3.17'% | 5th rank |
| SOL'USD price | $243.03 | +1.06'% |
| OBV | +10.65'% | 2'point support |
| Resistance | $243.28 | Exit target |
| Liquidity | 6.44'% | |
| Volatility | 1.97'% | |
| Confidence | 85 | |
| Signal | BUY |
Key Takeaway
- With SOL hovering near a strong support and OBV indicating buying pressure, the asset is poised for an upward impulse into the resistance at $243.28.
- The composite analysis confirms a bullish impulse phase; therefore the recommended trade is a short'term buy with a target at $243.28 and a stop at $242.80.
Engage now and ride the SOL wave'don't miss out.