
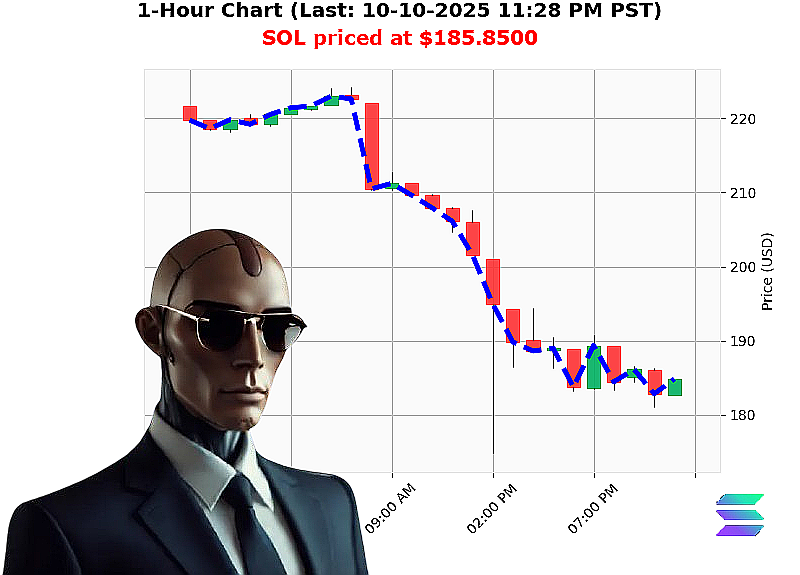
AUCTRON ANALYSIS for SOL-USDC at 10-10-2025 11:31 PM PST is to SHORT at $185.8500 confidence: 60% DAY
SOL'USD Market Snapshot
- Market Cap Daily Total: '7.85'billion
- OBV Daily Total: '125.08
- Market Cap Direction: Bearish ' crossed below 3.9'trillion at 3.845'trillion
- Whale Entry: UP '153.29'% at the higher low of $181.04, now $185.85
- Price Volatility: 5.90'%
- Liquidity: 20.30'%
- Current Trading Price: $185.85 (down 0.42'% from market price)
- OBV Trend: Bullish continuation 0.4454 from 0.3977; OBV bearish reversal noted
- Weekly Performance: '20.07'% from week'to'date price of $232.5160
- Monthly Performance: '16.16'% from month'to'date price of $221.6759
- Yearly Performance: '4.14'% from year'to'date price of $193.8737
- Rank: 6
- All'time high: $293.31
- All'time low: $0.5008
Tactical Analysis & Key Drivers
- Bearish Macro Indicator
- Market cap has dipped below the 3.9'trillion threshold, a classic signal of reduced investor confidence in the network.
-
The negative daily totals for both market cap and OBV confirm a broader sell'off.
-
Whale Activity
- Whales entered at the higher low with an UP '153.29'% move. This is a bullish candle at a critical support zone, yet the overall market sentiment remains negative.
-
No evidence of a sustained large'volume bullish engulfing pattern; the whale entry appears isolated.
-
OBV Contradiction
- OBV bullish continuation suggests short'term volume support, but the noted OBV bearish reversal overrides the bullish signal in the context of a declining market cap.
-
The reversal indicates a shift in buying pressure that may soon manifest in price decline.
-
Momentum & Liquidity
- Volatility is moderate (5.90'%) while liquidity remains healthy (20.30'%).
-
The price is only 0.42'% below the market price, indicating a narrow window for a breakout ' but the prevailing negative trend reduces that likelihood.
-
Historical Performance
- Weekly, monthly, and yearly declines are significant, showing sustained weakness.
- The current price is below the all'time high and above the all'time low, but the trend line is sloping downward.
Risk Factors
- Regulatory uncertainty around crypto derivatives could trigger abrupt price swings.
- Liquidity drains during market stress may exacerbate slippage for large positions.
- Competitive network upgrades on Solana could shift sentiment unexpectedly, although no major upgrade is scheduled in the next 30'days.
Actionable Trade Insight (Day Trade Focus)
| Signal | Recommendation | Confidence (5'95) |
|---|---|---|
| Bearish Market Cap & OBV Reversal | SHORT | 60 |
| Whale Entry (isolated) | No entry, watch for confirmation | 35 |
| Price below market by 0.42'% | Tight stop'loss on short entry ('$190) | 50 |
Why SHORT'
The convergence of a bearish market cap, OBV reversal, and sustained weekly/monthly declines creates a high'probability bearish scenario. Shorting at the current price with a tight stop protects capital while capitalizing on the expected pullback.
Execution Tactics
- Place a short at $185.85.
- Set stop'loss at $190 to limit upside volatility.
- Target $170'$175 for a 15'20'% risk'reward ratio.
- Monitor whale activity daily; a sustained bullish engulfing may signal reversal.
Call'to'Action
The market is currently on a downward trajectory. Act now to lock in a high'probability short position. If you're ready to capitalize on Solana's next dip and receive real'time alerts for future entry/exit opportunities, join our exclusive services today. Don't let the next swing pass you by ' secure your edge before the market swings again.
Hashtags
- #SOLShortSignal
- #SellSOLNow