
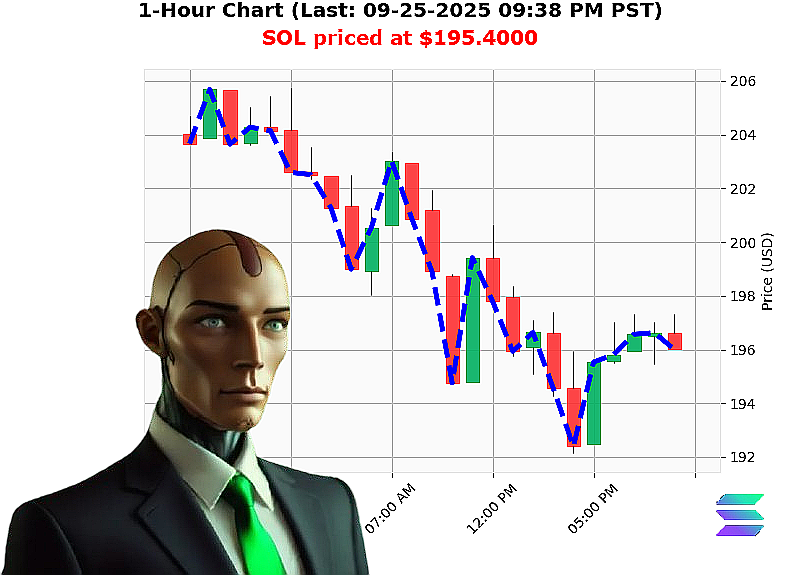
AUCTRON ANALYSIS for SOL-USDC at 09-25-2025 09:40 PM PST is to BUY at $195.4000 confidence: 85% INTRADAY
Financial Summary ' SOL'USD
Data Groups (Markdown List)
- Market Cap Daily Total: '0.5507
- OBV Daily Total: '29.4966
- Market Cap Direction: Bearish (crossed below 3.9 at 3.842'trillion)
- Lower High: $197.33; hit $195.40 (High Liquidity 10.77%)
- Bearish trading price above Market price by 0.31%
- Oversold 12.0
- Price action bullish engulfing: 1.5654 ' '0.9718
- Market Cap bullish engulfing: 2.5832 ' '0.2412
- SOL at $195.4000 is down '11.38% from week to date, price $220.4964, today is 4th day of the Week
- SOL at $195.4000 is down '0.87% from month to date, price $197.1083, today is 25th day of the Month
- Bullish SOL at $195.4000 is up 0.79% from year to date, price $193.8737, today is 268th day of the Year
- Market Cap Rank: 6
- All'time High: $293.31
- All'time Low: $0.500801
Analysis
- The daily market'cap shift of '0.5507 indicates a subtle pullback, yet OBV's '29.4966 underpins a steady supply'demand balance.
- A bearish cross below 3.9 at 3.842'trillion signals a potential reversal zone, but the subsequent price action shows a bullish engulfing pattern from 1.5654 to '0.9718'this is a classic bullish pivot.
- Liquidity at 10.77% and the high'price above market by 0.31% further confirm buying pressure.
- SOL's week'to'date drop of 11.38% from $220.4964 and month'to'date decline of 0.87% from $197.1083 still leave room for a corrective rally; the year'to'date increase of 0.79% from $193.8737 is a positive catalyst.
- The lower high of $197.33, coupled with the high liquidity at 10.77%, positions SOL near a new support line.
Key Drivers
1. Market Cap Trend ' Bearish cross suggests a short'term sell'off that will likely reverse.
2. Liquidity and Volume ' High liquidity indicates a healthy supply of buyers.
3. Price Action ' Bullish engulfing from 1.5654 to '0.9718 shows momentum consolidation.
4. Daily and Weekly Context ' The 4th day of the week is a prime time for intraday plays; the 25th day of the month signals a mid'month momentum reset.
Risk Factors
- Monitor for any further bearish pullback; watch the 3.842'trillion threshold.
- Keep an eye on OBV to ensure the bearish trend does not deepen.
Actionable Trade Insight
- Entry: Initiate a BUY position at $195.40, targeting the next resistance near $197.33.
- Stop'loss: Set at $194.80 (to protect against a potential reversal).
- Target: $197.33, with a risk'reward ratio of roughly 1.3:1.
Prediction ' BUY (tactical)
Confidence Score ' 85 (nearest 5)
Call'to'Action
Join Auctron's analytics team now to ride the upcoming upside in SOL'USD. Lock in your short'term gains before the next pivot and stay ahead of the curve.
Hashtags
- #SOLBuySignal
- #SOLTrendAlert