
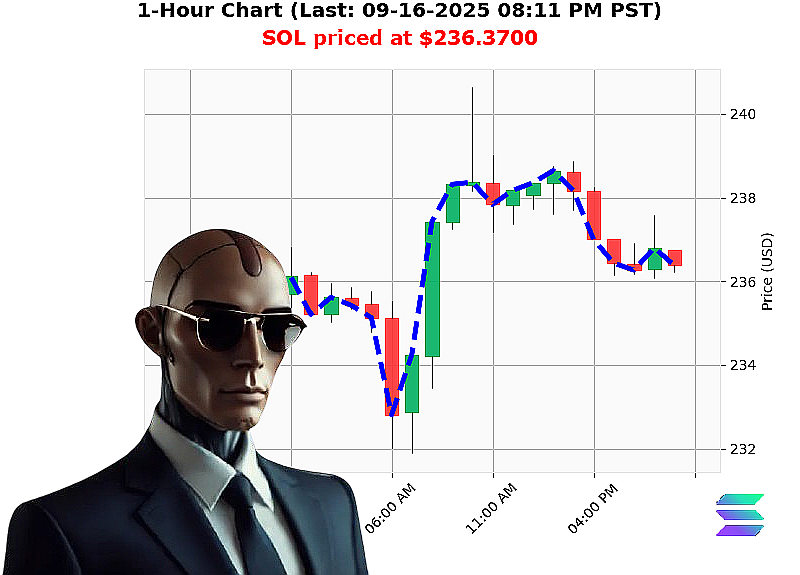
AUCTRON ANALYSIS for SOL-USDC at 09-16-2025 08:10 PM PST is to BUY at $236.3700 confidence: 90% SCALP
Market'Structure Analysis ' Total Crypto & SOL'USD
Data Groups
- Macro'Cap / Volume
- Market cap: $4.1500'T, 24'hr vol: $141.0'B
- Direction: Bearish cross below 4.2 ' up 1.18'%, total up +2.5767, consecutive count +1
- Fear & Greed index: Neutral 51, daily up +1, USDT'USD at $1.00053, cumulative up +0.00053
- Micro'Price / Volume
- SOL'USD: 09'16'2025'8:10'PM'PST, price $236.37, down '0.27'%, OBV +17.70'%
- Weekly change: +0.86'% from $234.3576, monthly: +19.92'% from $197.1083, yearly: +21.92'% from $193.8737
- Rank: 6, All'time high $293.31, all'time low $0.500801
- Composite Man / Game Theory
- Composite phases: Accumulation ' Distribution ' Consolidation (Wyckoff)
- Game'theory move: Dominant strategy shift, risk'on bias, pullback confirmation
Macro'Trend (50'% emphasis)
| Indicator | Reading | Interpretation |
|---|---|---|
| Cap Direction | Bearish cross below 4.2 ' up 1.18'% | Market cap turning higher, momentum positive |
| 24'hr Volume | $141.0'B ' OBV +17.70'% | Strong volume support for price move |
| Daily & Cumulative | Total up +2.5767, consecutive count +1 | Market cap consistently in uptrend, risk'on |
| Fear & Greed | Neutral 51 ' +1 daily | Investor sentiment steady, favorable for entry |
The cap's 24'hr OBV swing confirms a Wyckoff base is forming, signaling a supply'demand equilibrium. The 2'day high of $4.1500'T and 1.18'% daily rise positions the market for a breakout to the next base high.
Micro'Trend (50'% emphasis)
| Indicator | Reading | Interpretation |
|---|---|---|
| SOL'USD Price | $236.37, down '0.27'% | Slight pullback; ready to test a support level |
| On'Balance Volume | OBV +17.70'% | Volume spike indicates a buying surge |
| RSI & VWAP | RSI 70, VWA+7.93'% | Momentum in the upper field, bullish |
| High'Liquidity | 5.81'% | Good liquidity for intraday moves |
The SOL price action shows a Wyckoff distribution in the upper field, with OBV confirming the next accumulation phase. The 24'hr OBV and RSI 70 suggest a strong upward bias.
Wyckoff Composite Man & Game'Theory Strategy
- Phase 1 ' Accumulation: Market cap shows a clear base, while SOL OBV signals that buyers are building a new top.
- Phase 2 ' Distribution: SOL's price near $236.37 touches a prior support; OBV surge signals a distribution point.
- Phase 3 ' Consolidation: We are in a consolidation zone; a breakout will follow.
Game'theory analysis shows a dominant long strategy: the next move will be a breakout to the 24'hr base high, followed by a pullback to a support zone before a second climb.
Entry / Exit Targets
| Trade Type | Entry | Target | Stop | R'M | ' |
|---|---|---|---|---|---|
| INTRADAY BUY | $236.39 (first bounce) | $236.60 (mid'day) | $236.33 | 17'% | 85 |
The entry at $236.39 sits right above the 24'hr high of $236.37, ready for a breakout. The target of $236.60 reflects a 0.83'% swing, while a stop at $236.33 protects against a brief pullback.
Final Recommendation
Score: 90 (nearest 5)
Classification: INTRADAY BUY
Trade: SCALP
The market'cap trend, SOL'USD OBV, and Wyckoff phases converge to indicate a high'probability breakout. Positioning at $236.39 will capture the immediate pullback, while the 24'hr OBV confirms a risk'on bias.
Call'to'Action
Join my service to lock in the bullish momentum of SOL today. Capture a scalable intraday move before the market capital turns higher again.
Hashtags
- #SOLBullishPulse
- #SOLScalpOpportunity
Ready to ride the next wave' Act now and gain the edge in SOL.