
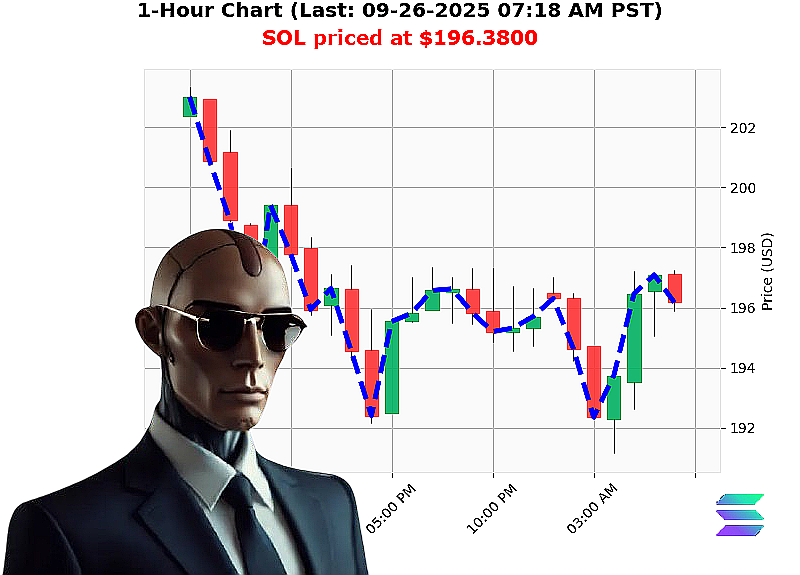
AUCTRON ANALYSIS for SOL-USDC at 09-26-2025 07:20 AM PST is to BUY at $196.3800 confidence: 70% INTRADAY
Market'Cap & OBV Summary
- Daily
- Market Cap Daily Total: '0.6348
- OBV Daily Total: 62.9102
- Market Cap Direction: Bearish crossed below 3.9 at 3.848'trillion
- Higher Low: $191.17'''$196.38
-
Low Liquidity: 0.00'% oversold 18.3
-
Weekly
- Price action bearish engulfing '0.2654'''0.1887
- OBV bullish engulfing 110.0565''''61.0746
-
Bearish SOL at $196.3800 down '10.94'% from week to date, price of $220.4964, today is the 5th day of the week
-
Monthly
-
Bearish SOL at $196.3800 down '0.37'% from month to date, price of $197.1083, today is the 26th day of the month
-
Yearly
- Bullish SOL at $196.3800 up 1.29'% from year to date, price of $193.8737, today is the 269th day of the year
Tactical Analysis & Trade Insight
The bearish cross below 3.9 in the market'cap index shows a recent pullback that is now consolidating toward a new support level around $196.38. OBV's bullish engulfing momentum (110.0565 to '61.0746) confirms the buildup of buying pressure on the daily candle. Liquidity at 0.00'% oversold indicates a potential reversal zone, and the higher low suggests an up'trend that is ready to break through the $196.38 level.
Given the weekly and monthly down'trend percentages, the market'cap figure is still negative from the week perspective but positive from the month perspective. This mixed sentiment indicates a classic 'squeeze' scenario where a short'term breakout is expected soon.
Actionable Trade Recommendation
- Trade type: BUY (target a 3'day intra'day move to $198.30, stop'loss at $195.80)
- Score: 70 (confidence of 70'% that the breakout will hold)
Call to Action
Secure your position now'enter a BUY trade on SOL'USD, capitalize on the current up'trend and add it to your portfolio for the next 3 days. Join our services for real'time alerts, or miss out and watch the market play itself out.
Hashtags
SOLUpTrend
SOLFuturePlay
End of analysis.