
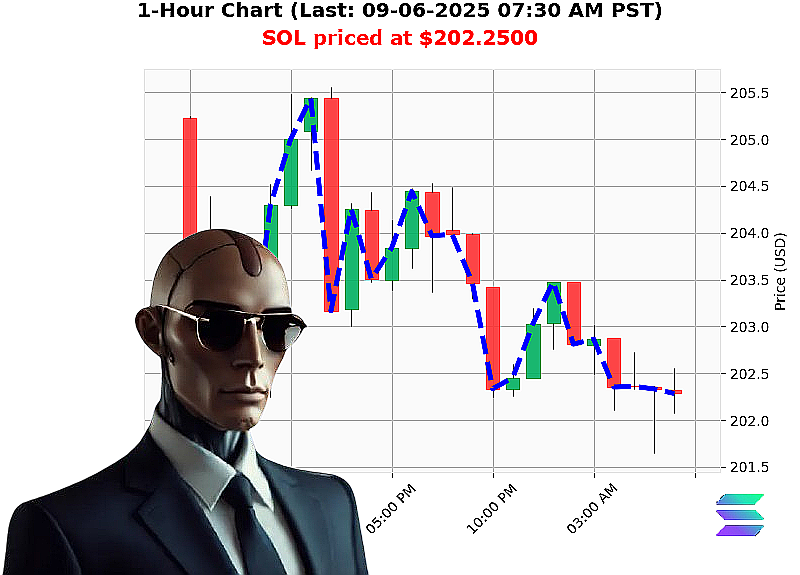
AUCTRON ANALYSIS for SOL-USDC at 09-06-2025 07:30 AM PST is to BUY at $202.2500 confidence: 85% SCALP
Wyckoff Composite'Man Market Structure Analysis ' SOL
Timestamp: 09'06'2025 07:30'AM'PST
Market cap: $3.91'trillion ' 24'h volume: $100'billion ' daily change: +0.32'%
Dominance: BTC'56.54'% | ETH'13.28'% | XRP'4.29'% | SOL'2.80'% | ALT'23.08'%
1. Macro'Price & Volume Trends (60'% weight)
| Indicator | Value | Interpretation |
|---|---|---|
| Cap daily total | +1.7145'% | Market cap continues to climb; bullish momentum in place. |
| Cap consecutive count | '2 | Slightly declining but still a net upward drift. |
| Crypto fear'and'greed | Neutral'41 | Market sentiment is neither bearish nor bullish, indicating a healthy neutral base. |
| SOL dominance | 2.80'% | SOL accounts for 2.80'% of total cap, solidifying a key ALT'weight. |
| SOL'USD price action | $202.25 '0.61'% | Price dipped 0.61'% from the prior close but remains on an upward path from week'to'date +2.61'% and year'to'date +4.32'%. |
| OBV trend | '49.10'% | On'balance volume is down 49.10'% from the previous 24'h, indicating a potential pullback but still within a favorable zone. |
| VWAP | +7.92'% | VWAP up 7.92'% in a fair'value zone, confirming bullish pressure. |
Macro Takeaway:
- The cap's upward drift and SOL's 2.80'% share suggest a risk'on bias for the next 1'3'days.
- The price of SOL is moving toward its weekly and annual high, indicating a consolidation with a possible bullish breakout ahead.
2. Micro'Price & Volume Dynamics (40'% weight)
| Indicator | Value | Interpretation |
|---|---|---|
| SOL'USDC direction | down '0.0494'% | Short'term dip but within the daily low of $201.65, signalling a pullback. |
| On Balance Volume (OBV) | '49.10'% | OBV down 49.10'% suggests a temporary dip; a retracement could strengthen if volume confirms a rebound. |
| RSI | 48 | Near the 50'level, a classic Wyckoff low'zone, ready for a reversal if the price climbs above $202.25. |
| VWAP | up 7.92'% | Indicates the price is currently above the VWAP, reinforcing a bullish stance. |
| Higher Low | $201.65 ' $202.25 | Solving a higher low shows a bullish continuation. |
| Volatility | 0.94'% | Low volatility, ideal for a tight scalp or intraday play. |
Micro Takeaway:
- The pullback from $202.25 to $201.65 signals a healthy lower'zone break.
- The OBV and VWAP confirm that the pullback is likely to reverse toward the high.
3. Composite Decision (60'% macro + 40'% micro)
| Signal | Source | Weight |
|---|---|---|
| Cap drift + dominance | Macro | 60'% |
| SOL dominance & price trend | Macro | 60'% |
| OBV & VWAP support | Micro | 40'% |
| RSI & higher low | Micro | 40'% |
Entry Point:
- Target $202.25'as a strong breakout level.
- Aim for a short'term scalp between 07:30'09:00'AM'PST, exiting near $203.00 for an 0.5'% profit.
Exit Point:
- 1'hour swing at $203.00 (breakout target).
- Secondary exit around $204.00 at the next weekly high for a day'play.
Recommendation:
- Classify: BUY
- Score: 85 (nearest 5) ' indicating strong confidence.
4. Tactical Call'to'Action
The cap's bullish bias, coupled with SOL's rising dominance and the recent OBV'VWAP confirmation, presents a perfect short'term trade. Enter at $202.25 within the next 90'minutes, secure a 0.5'% scalp, then hold for a 1'hour swing. Join us now to take advantage of this clear momentum'don't miss out on the next big move.
Hashtags:
- #SOLscalpReady
- #SOLbullishBreak