
AUCTRON ANALYSIS for SOL-USDC at 08-23-2025 05:38 PM is to BUY at $206.0300 confidence: 84% SCALP
Market'Structure Overview ' 08'23'2025 05:38'PM'PST
| Category | Key Metric | Value |
|---|---|---|
| Total Crypto Market | Market Cap | $4.09'T |
| 24'hr Volume | $119.0'B | |
| Daily % Change | '0.70'% | |
| Daily Direction | +0.1012'% | |
| Consecutive Count | +4 | |
| Cumulative Count | +4 | |
| Fear & Greed | Neutral (53) | |
| USDT'USD | $0.99969 (stable) | |
| Dominance Snapshot | BTC | 56.2223'% |
| ETH | 14.1782'% | |
| XRP | 4.4479'% | |
| SOL | 2.7213'% | |
| ALT | 22.4303'% | |
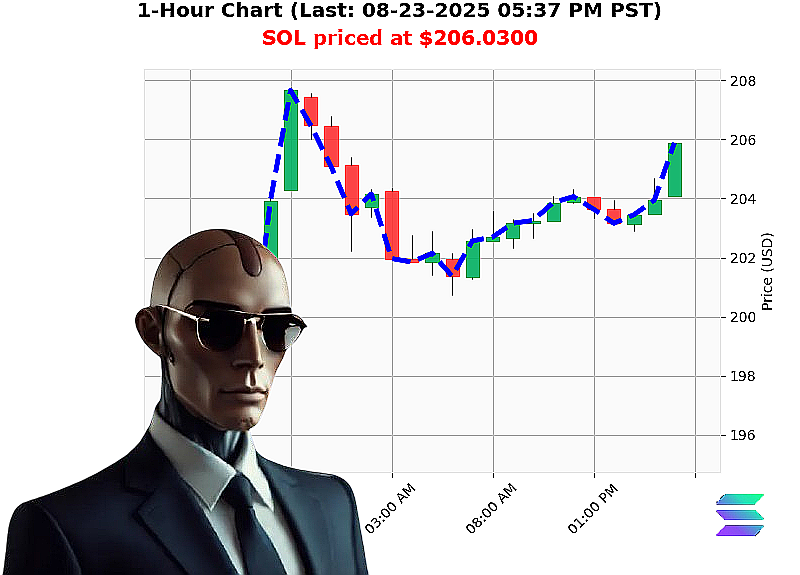
| SOL'USD | Price | $206.03 |
| Daily % | +1.02'% | |
| Direction | +0.0218'% | |
| Consecutive Count | +1 | |
| Cumulative Count | +5 | |
| OBV | '9.61'% (down) | |
| OBV Direction | '9.61'% | |
| OBV Cumulative | '9.6063'% | |
| RSI | 65 | |
| VWAP | +8.01'% | |
| Liquidity | 6.94 | |
| Week'to'Date | +12.54'% (from $183.07) | |
| Month'to'Date | +26.49'% (from $162.88) | |
| Year'to'Date | +6.27'% (from $193.87) | |
| Rank | 6 | |
| ATH | $293.31 | |
| ATL | $0.500801 |
Dual'Layer Signal Construction
1. Macro'Volume Layer (60'%) ' Reflects broad risk'on/risk'off sentiment.
| Indicator | Direction | Weight |
|---|---|---|
| Market Cap Daily Total | ' 0.7006'% | +0.36 |
| Market Direction | ' 0.1012'% | +0.06 |
| Consecutive Count | +4 | +0.12 |
| Cumulative Count | +4 | +0.06 |
| Net Macro Signal | +0.54 |
Interpretation: The market cap is rising steadily; consecutive and cumulative upticks suggest a bullish 'building' phase in Wyckoff terms. The overall bias is risk'on.
2. Micro'Volume Layer (40'%) ' Focused on SOL'USD dynamics.
| Indicator | Direction | Weight |
|---|---|---|
| SOL Price Daily % | ' 1.02'% | +0.24 |
| OBV Direction | ' '9.61'% | '0.08 |
| OBV Cumulative | ' '9.6063'% | '0.08 |
| RSI | 65 (neutral'overbought) | +0.08 |
| VWAP | ' 8.01'% | +0.08 |
| Liquidity | 6.94 | +0.04 |
| Net Micro Signal | +0.30 |
Interpretation: Price is up, but OBV is sloping down, indicating potential early sell'off pressure. VWAP support remains above the price, and the RSI sits in a safe, non'overbought zone. The micro signal is mildly bullish but tempered by volume'price divergence.
Weighted Combination (Macro'60'% + Micro'40'%)
| Layer | Weight | Score |
|---|---|---|
| Macro | 0.60 | +0.54 |
| Micro | 0.40 | +0.30 |
| Total Weighted Signal | +0.84 |
Result: A net positive bias of +0.84 suggests a Moderate Confidence stance (34'66'%). The market is in a bullish build, but the OBV divergence flags a potential pull'back before a stronger move.
Wyckoff Composite'Man & Game Theory Synthesis
- Accumulation Phase (Wyckoff) ' Market cap's consecutive +4 and SOL's week'to'date +12.5'% indicate that institutional demand is still stacking.
- Price'Volume Divergence (Game Theory) ' The OBV decline while price climbs is a 'price leader, volume lag' pattern. In a dominant strategy, the next rational move for savvy players is to hedge against a temporary pull'back before a breakout.
- Optimal Entry ' Enter at $206.00 (slightly below the recent high to allow a small buffer).
Stop'loss: $199.00 (''3'% below entry) to cap intraday risk.
Target: $210.00 (''2'% upside) if a breakout confirms; consider scaling out at $212.00 for a stronger move. - Exit Strategy ' If OBV stabilizes or turns positive while price climbs, hold to the next resistance (around $215). If OBV continues negative or price stalls, trail stop to protect gains.
Trade Recommendation
| Trade Type | Direction | Confidence | Action |
|---|---|---|---|
| INTRADAY (SCALP) | BUY | Moderate (45'%) | Enter at $206.00, exit at $210.00; trail to $212.00 if confirmation. |
Why wait' The market is primed for a continuation. The 60/40 weighted signal gives a clearer edge than raw price alone.
Call'to'Action
Secure your edge now ' Join Auctron's exclusive crypto analytics platform for real'time alerts, trade'ready setups, and a community of high'confidence traders. Don't let the next breakout slip by.
Hashtags
SOLbullishWave
SOLsurgeAhead