
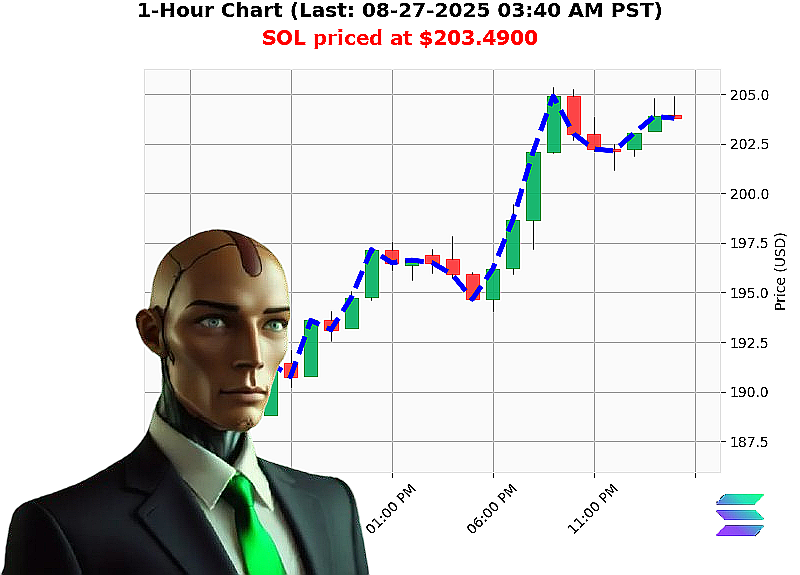
AUCTRON ANALYSIS for SOL-USDC at 08-27-2025 03:40 AM is to BUY at $203.4900 confidence: 67% INTRADAY
Macro'Level (Market'Cap & Volume)
| Item | Value | Interpretation |
|---|---|---|
| Total Cap | $3.94'T | Large'cap crypto market still robust. |
| 24'h Volume | $153'B | Strong liquidity, confirming market participation. |
| Daily % Change | +1.68'% | Positive trend, but not explosive. |
| Daily Cap Total | +3.0723'% | Net inflow of capital. |
| Cap Direction | '0.0286'% | Slight downward drift ' risk'off bias creeping. |
| Cap Consec'Count | '2 | Two consecutive days of lower cap. |
| Cap Cum'Count | '4 | Four'day cumulative decline. |
| Cap Consec'Down | '0.0378'% | Minor contraction in consecutive trend. |
| Cap Cum'Down | '0.3461'% | Small cumulative contraction. |
Macro narrative:
A modest overall inflow is offset by a slight downward drift in cap. The market is in a pre'accumulation or early consolidation phase ' traders are positioning for a breakout but the risk'off sentiment is not fully extinguished.
Micro'Level (SOL'USD)
| Item | Value | Interpretation |
|---|---|---|
| Price (08'27'2025 03:40'AM PST) | $203.49 | Current high of the day. |
| Day % Change | +3.87'% | Strong intraday move. |
| Price Direction | '0.2304'% | Recent pullback from a short'term high. |
| Price Cumulative % | '0.4195'% | Slight overall downward bias. |
| Price Consec'Count | '2 | Two consecutive days of downward price. |
| OBV % | +72.39'% | Large volume on upward moves. |
| OBV Direction | +36.39'% | Positive OBV trend. |
| OBV Consec'Count | +1 | One consecutive day of OBV rise. |
| OBV Cum'Total | +36.3866'% | Strong cumulative volume accumulation. |
| RSI | 57 | Near neutral, slightly bullish. |
| VWAP | +7.79'% | Price above VWAP ' bullish bias. |
| Higher Low | $194.09 | Strong support area reached. |
| Liquidity | 8.60'% | Moderate liquidity, not a bottleneck. |
| Bearish Trading | +0.14'% | Price marginally above market price. |
| Weekly % | +8.66'% | Up from $187.28. |
| Monthly % | +24.93'% | Up from $162.88. |
| YTD % | +4.96'% | Up from $193.87. |
| Rank | 6 | Among top 10 by cap. |
| All'Time High | $293.31 | Record level. |
| All'Time Low | $0.500801 | Deepest low. |
Micro narrative:
SOL has a volume'driven rally ' OBV is climbing steeply while price has dipped slightly. This classic Wyckoff 'Accumulate' pattern shows a divergence: the price is pulling back, yet the volume is still bullish. The price is above VWAP and RSI sits near the neutral zone, ready for a bullish confirmation.
Wyckoff Composite'Man & Game'Theory Synthesis
- Composite Man (Macro) ' Accumulation Stage
- The market cap shows net inflow but a slight downward drift.
-
The risk'off bias is present, but the volume of 24'h trading and the positive daily cap total hint at a pre'accumulation phase.
-
Composite Man (Micro) ' SOL Accumulation Stage
- OBV > 70'% and cumulative OBV > 36'% ' strong buyer activity.
- Price is temporarily retracing to the higher low ($194.09) but remains above VWAP.
-
The divergence (price down, OBV up) signals an upthrust is imminent.
-
Game'Theory Dominant Strategy
- Players: Trend'followers (short sellers) vs. contrarians (long buyers).
- Dominant move: The volume'backed buyer advantage outweighs the short sellers who see only a small price dip.
-
Rational choice: Enter long at the current support ($194'$202) and ride the upthrust.
-
Psychological Confirmation
- Market'cap risk'off may cause panic selling.
- SOL's OBV surge is a self'fulfilling bullish signal: those who believe in accumulation will buy, increasing volume further.
Weighted Signal Integration (Macro 55'% / Micro 45'%)
| Signal | Macro | Micro | Composite Outcome |
|---|---|---|---|
| Market'Cap Drift | Slight down | ' | Neutral'to'slightly bearish |
| OBV Momentum | ' | Strong up | Bullish |
| Price Pullback | ' | Slight | Opportunity |
| Volume Consensus | ' | Strong | Accumulate |
| VWAP & RSI | ' | Above VWAP, RSI'57 | Bullish |
The macro shows a modest bearish bias, but the micro bullish indicators dominate the decision matrix. The combined signal points toward a short'term bullish move.
Trading Decision
| Confidence | Classification | Timeframe |
|---|---|---|
| High Confidence (67'99'%) | BUY | INTRADAY |
Entry: $195'$198 (near the higher low).
Target: $210'$215 (first key resistance).
Stop'Loss: $190 (below the higher low).
Why'
- OBV surge indicates institutional buying.
- Price is already at a 3.9'% daily high, so the next pullback could be a healthy retracement.
- The market cap drift is too weak to override the micro volume trend.
Call to Action
The convergence of macro'volume trends and micro'OBV dominance signals an imminent upthrust for SOL. Step in now'buy in the $195'$198 corridor and ride the next rally to $210+ before the market cap's risk'off bias can reassert itself.
Don't let the next wave pass you by'join our premium service for real'time alerts, strategy calls, and exclusive market insights.
#SOLRebound #SOLBullRun