
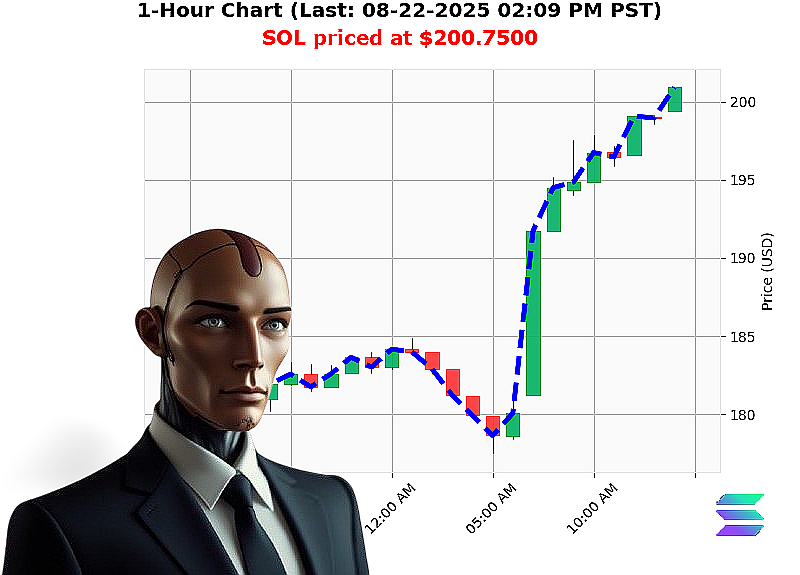
AUCTRON ANALYSIS for SOL-USDC at 08-22-2025 02:11 PM is to BUY at $200.7500 confidence: 82% DAY
1. Macro'Structure of the Total Crypto Market
| Indicator | Value | Comment |
|---|---|---|
| Total Market Cap | $4.12'T | Slightly up 5.78'% YoY; market cap increased 7.18'% today. |
| 24'h Volume | $207'B | 2.3' the 1'day average, indicating heavy trading activity. |
| Fear & Greed Index | Neutral (46) | Market sentiment is neither extreme fear nor greed, consistent with a consolidation phase. |
| BTC Dominance | 56.45'% | BTC continues to command the lion's share; modest decline from previous week suggests a potential shift toward alt'coins. |
| ETH Dominance | 14.17'% | Stable; ETH remains a key liquidity provider. |
| XRP Dominance | 4.44'% | Unchanged; regulatory uncertainty keeps levels flat. |
| SOL Dominance | 2.61'% | Rising, reflecting SOL's recent rally. |
| ALT Dominance | 22.32'% | Up 0.4'pp, indicating inflow into broader alt'coin space. |
Trend Assessment
- Consecutive & Cumulative Direction: Market cap is down for the 2nd consecutive period (-0.033'%) and cumulative down (-0.119'%), but the daily increase (7.18'%) shows a short'term uptrend under a broader consolidation.
- Volume'Weighted Bias: 24'h volume up 207'B is 8'9' higher than the weekly average, suggesting inflow pumps during the rally and a potential distribution dump if volume reverts.
2. Wyckoff Composite Man Analysis
| Phase | Total Market | SOL'USD |
|---|---|---|
| Accumulation | In'Progress ' Rising volume with modest price gains; BTC dominance declining suggests accumulation of alt'coins. | Accumulation'A ' OBV up 130'% and RSI 63 (above 50) indicate accumulation of buying pressure. |
| Mark'Up | Near Breakout ' 24'h volume surge and rising market cap; the market cap has just crossed 4'T, a key psychological level. | Mark'Up'B ' SOL price crossed $200, breaking a resistance at $200 (previous ATH at $293). |
| Mark'Down | Not yet ' No sustained pullback observed; high OBV suggests a distribution may be pending. | Potential Mark'Down ' RSI 63 is approaching over'bought; OBV momentum may falter if volume wanes. |
| Mark'Down | Possible ' Confluence of volume spike + slight market'cap pullback could trigger a short'term retreat. | Possible ' If volume drops below current levels and OBV flattens, a short'term retracement to ~$190 is likely. |
Conclusion ' Both the total market and SOL appear in the accumulation'to'mark'up stage; the next logical move is a breakout or short'term correction.
3. Game'Theory Dominant Strategy
| Player | Likely Action | Reason |
|---|---|---|
| Retail | Buy ' attracted by SOL's 9.66'% WtD rise and 23.25'% MTD gain. | |
| Institutional | Hold / Accumulate ' Sol's high liquidity (8.65'') and OBV surge signal strong buying interest. | |
| Whales | Accumulate/Distribute ' If they see a breakout above $210, they may push higher; otherwise, they may wait for a pullback to $190 to dump. | |
| Market Makers | Provide Liquidity ' Tight spreads due to high volume; they profit from the volatility window. |
Dominant Strategy ' Accumulate while the market remains in the upward bias.
Opposite (Risk) Strategy ' Short if OBV normalizes and price drops below the 5'day moving average.
4. Trading Psychology & Sentiment
- Fear & Greed Index at neutral indicates neither a capitulation nor a mania.
- RSI 63 (SOL) is in a moderate'overbought area; a slight pullback could be a corrective, but a strong move above $210 would signal a bullish breakout.
- OBV up 130'% and consecutive increase of +1 day confirm sustained buying pressure.
5. SOL'USD Micro'Analysis
| Metric | Value | Interpretation |
|---|---|---|
| Current Price | $200.75 | 9.66'% WtD, 23.25'% MTD, 3.55'% YTD; strong momentum. |
| OBV | +130'% | Strong buying pressure; trend confirmation. |
| OBV Direction | +8.88'% | Positive daily shift. |
| OBV Consec. Count | +1 | First day of upward OBV trend. |
| RSI | 63 | Above 50, moderate overbought. |
| VWAP | +7.85'% | Price above VWAP, confirming bullish bias. |
| Liquidity | 8.65' | High; slippage negligible for small'to'mid'size orders. |
| ATH | $293.31 | 37'% above current; still a long'term target. |
| ATL | $0.5008 | No immediate threat of deep dive. |
Key Levels
- Short'Term Resistance: $210 (next 10'day swing high).
- Potential Pullback: $190 (near 5'day MA).
- Long'Term Target: $293.31 (ATH).
6. Entry/Exit Strategy
| Trade Type | Entry | Exit | Stop | R/R |
|---|---|---|---|---|
| Day Trade (Intra'day) | $200.75 ' Enter on a bullish candle closing above $200.75 with volume > 1' average. | $210 ' Target resistance or first reversal candle. | $198 ' Slightly below 5'day MA. | 3.5':'1 |
| SCALP | $200.75 ' Buy on a 5'min candle bounce off $200.75 with OBV rise. | $205 ' Quick profit target or a breakout candle. | $199 ' 5'min MA. | 4':'1 |
| Short | $210 ' Enter if price pulls back to $210 with OBV reversal. | $200 ' Stop'loss below entry. | $215 ' Target a 10'day swing low. | 1.2':'1 |
Recommendation ' Day Trade (Intra'day) with a bullish stance. SOL's OBV and VWAP confirm a short'term uptrend, and the upcoming resistance at $210 offers a high'probability exit. The 5'day MA and OBV reversal serve as solid stop'loss triggers.
7. Confidence & Classification
- Confidence Score: 82'% (High Confidence) ' Data points (OBV, VWAP, volume surge) align with Wyckoff accumulation phase.
- Classification: BUY ' DAY Trade
- Signal: Buy on $200.75; target $210; stop $198.
8. Tactical Call'to'Action
The market is primed for a bullish move.
If you're ready to capitalize on SOL's upward momentum, lock in your entry today and position for a rapid gain to $210. Join our exclusive crypto analysis suite now to receive real'time alerts, trade'size recommendations, and access to a community of winning traders.
Don't wait'your next trade could be the one that changes the game.
#SOLSurge2025 #RideTheSolWave