
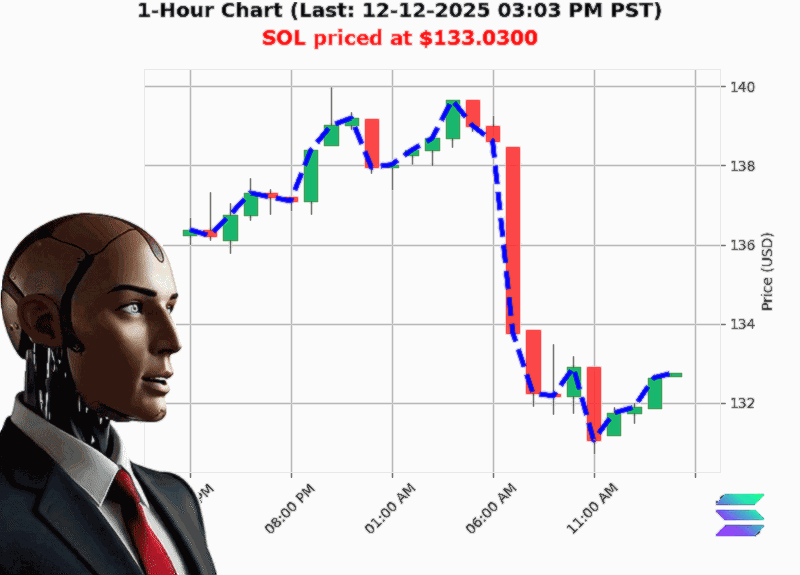
AUCTRON ANALYSIS for SOL-USD at 12-12-2025 03:05 PM PST is to BUY at $133.03 confidence: 80% INTRADAY-TRADE in BULL-MARKET Bullish SOL price crossed above $133.00 to $133.03 up 0.22% Higher Low from $130.80 to $133.03 up 1.71%
What the Numbers Tell Us About SOL'USD Today
(Market: BULL ' Trade Recommendation: BUY (Intra'day), Confidence Score 80/100)
SOL Just Breaks a Key Resistance
Takeaway: The price climbed above the $133.00 mark, posting a 0.22'% gain from the open.
Why it matters: A clear break of the $133.00 resistance suggests short'term bullish momentum. Coupled with the higher'low formation ($130.80 ' $133.03, 1.71'% rise), it signals that sellers are losing steam and buyers are regaining control.
'Bullish Fair Value Gap from $132.64 to $132.67 up 0.30% ' a micro'break that can snowball into a larger rally.'
Market Capitalization and Liquidity Signal Optimism
Takeaway: Despite a 2.18'% daily drop in total crypto cap, the SOL'specific cap edged up 0.16'% to $3.155'trillion, a new all'time high.
Why it matters: Market cap moving higher while the overall crypto market treads lower indicates a selective rally around SOL. Liquidity is healthy at 7.88'%, meaning trades can be executed with minimal slippage.
'Market Cap Direction Bullish ' crossed above $3.150'trillion.'
OBV and Volume: A Mixed Signal
Takeaway: On'Balance Volume (OBV) is down 40'% overall but has an upward direction of 0.10'% and an 11'candle consecutive rise.
Why it matters: The steep cumulative OBV decline suggests bearish sentiment on longer horizons, yet the short'term upward streak indicates that buying pressure is currently surging. For intraday traders, the recent OBV rally outweighs the long'term slide.
'OBV consecutive count up +11 ' a bullish short'term volume cue.'
Price Structure: A Break of Structure (BOS)
Takeaway: SOL moved from 132.64 to 133.03, a 0.30'% break of structure, confirming a bullish pivot.
Why it matters: BOS is a classic technical signal that sellers are losing dominance. In a scalp or intra'day strategy, this break offers a clear entry point.
'Bullish Break of Structure 132.64 to 133.03 up 0.30%.'
Contextual View: Weekly, Monthly, Yearly Frames
Takeaway:
- Week'to'Date: Down 0.19'% from $133.2782
- Month'to'Date: Up 4.99'% from $126.7090
- Year'to'Date: Down 31.38'% from $193.8737
Why it matters: The monthly rally is the most relevant for short'term traders. A 5'day week down only 0.19'% shows that the weekly bias is neutral, while the yearly decline reflects a longer'term correction that can be traded against.
'Bullish SOL at $133.0300 is up 4.99% from month'to'date price of $126.7090.'
Risk Factors & Volatility Check
- Daily cap decline (+2.18'%) could trigger a pullback.
- OBV swing (40'% cumulative drop) may surface if buying pressure falters.
- Weekly trend: Only a 0.19'% dip suggests potential sideways retracement.
Actionable Insight: Use a tight stop'loss at the 132.50 level (~0.38'% below current price) and target 134.30 (~1.2'% upside). Monitor OBV; a sudden reversal could warrant a quick exit.
Conclusion & Forward'Looking Question
SOL's recent breakout and bullish structure signals a short'term rally, but the underlying OBV slide and market'cap dynamics warn of potential reversals. Will the momentum sustain enough to double'double the gains, or will the long'term bearish trend pull it back'
Ready to trade with precision'
Join our Elite Crypto Analysis service for real'time signals, advanced risk management tools, and a community of top traders. Don't let the next wave slip by ' act now.
#SOLSignal #SOLTakeover