
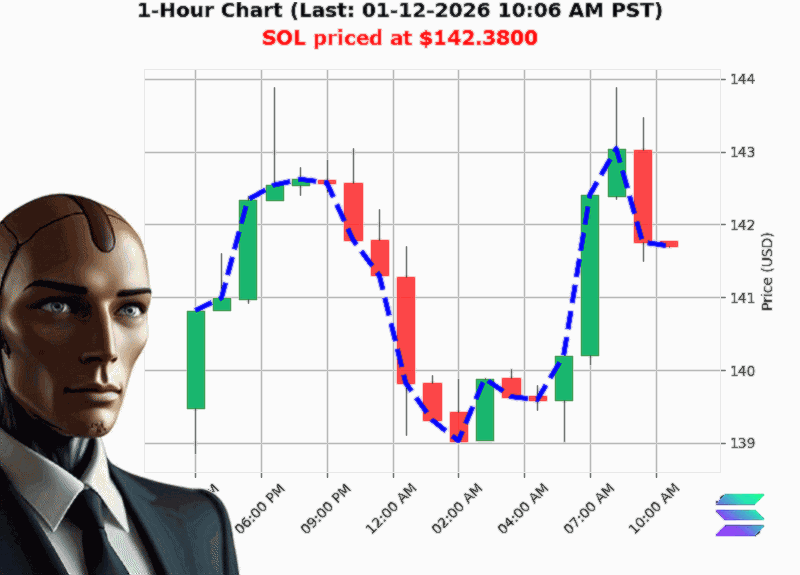
AUCTRON ANALYSIS for SOL-USD at 01-12-2026 10:11 AM PST is to BUY at $142.38 confidence: 75% INTRADAY-TRADE in BULL-MARKET Bullish SOL price crossed above $142.00 to $142.38 up 0.44% Higher Low from $138.89 to $142.38 up 2.52%
Prediction (Day'Trade Focus)
- Signal: BUY
- Confidence: 75'/'100
- Market: BULL
'SOL is riding a clear up'trend today ' the data say 'bullish break of structure' and a 33.9'% OBV jump.'
5 Surprising Takeaways from Today's SOL'USD Action
1. Bullish Break of Structure ' The Signal That Doesn't Tumble
SOL just punched through a key resistance at $142.00 to sit at $142.38 ' a 0.44'% bump since open. This break of structure (141.77 ' 142.38) is a textbook bullish cue that the current up'trend is alive.
'SOL price crossed above $142.00 to $142.38 up 0.44%'
2. OBV Explodes: Institutional Money is Backing the Rally
On'Balance Volume is up 33.94'% with an obv direction up of 0.01'%. That volume surge signals that the buying pressure is not just retail noise'it's institutional.
'OBV is up 33.94% with obv direction up 0.01%'
3. Liquidity at 8.24'%: A Deep and Solid Market Base
Liquidity at 8.24'% means a strong order book. You can enter a position without slippage and exit with confidence. High liquidity also protects against sudden gaps, which are a common pain point in crypto.
'High Liquidity at 8.24%'
4. Higher Low, Higher High: Momentum is Still Pumping
The last swing high was $138.89, and the current high is $142.38'an increase of 2.52'%. A higher low coupled with a higher high confirms that buyers are still in control, a pattern traders look for before committing a large trade.
'Higher Low from $138.89 to $142.38 up 2.52%'
5. Month'to'Date Rally vs Year'to'Date Decline ' A Time'Frame Insight
- Month'to'Date: up 12.32'% (since $126.76).
- Year'to'Date: down 24.49'% (since $188.56).
This tells us that while the long'term trend is bearish, the short'term rally is strong enough to consider a day'trade. The current environment is a 'short'term bull within a longer'term bear' scenario.
'SOL at $142.38 is up 12.32% from month to date price of $126.76'
Why This Matters
- Clear Entry: The break of structure and OBV spike give a low'risk entry point.
- Manageable Risk: With 8.24'% liquidity, you can set tight stops to guard against a swift reversal.
- Potential Exit: Watch the next swing high (~$144'$145) for a 2'3'% take'profit.
Forward'Looking Takeaway
If you're looking for a day'trade on SOL, the data suggest a 'bullish micro'trend' that can be capitalised on with a well'placed stop. The question is: Will the institutional buying keep the momentum through the next hour, or will the broader bear'trend bleed through'
Call to Action
Ready to ride SOL's short'term rally with precision'
Join our premium service for real'time alerts, advanced models, and a community of seasoned traders. Don't let the next breakout pass you by ' stay ahead, stay profitable.
#SOLBullRun #SolPower