
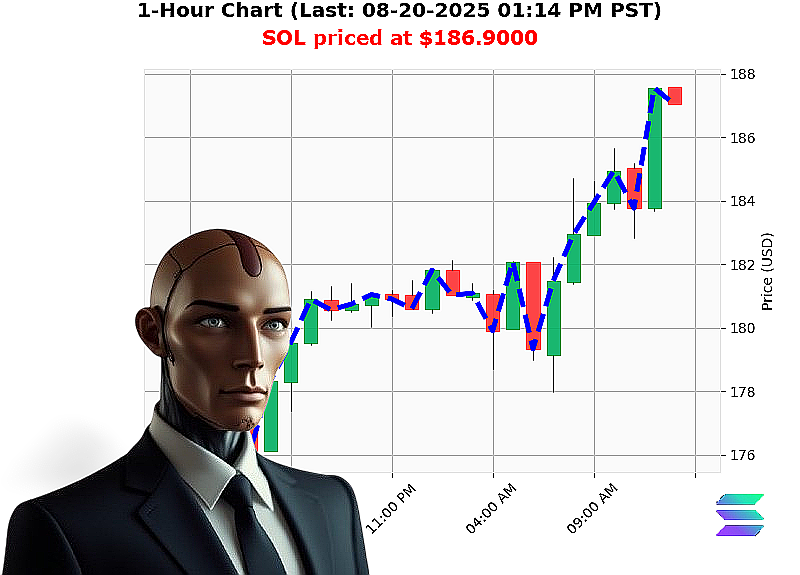
AUCTRON ANALYSIS for SOL-USDC at 08-20-2025 01:14 PM is to BUY at $186.9000 confidence: 85% INTRADAY
Wyckoff Composite'Man & Game'Theory Analysis
| Metric | Value | Interpretation | |--------|-------|----------------| | Total Market Cap | $3.97'trillion (''1.65'%) | Bullish trend, consecutive down count of '2 but cumulative up of +4. The overall macro picture is positive, suggesting inflow'driven pumps. | | Market Cap Direction | Bullish (crossed above 3.9) | Indicates a broad'based accumulation phase. | | SOL'USD Price | $186.90 (+6.12'%) | Strong short'term rally, breaking the $186 level. | | OBV | ''125.90'% | Volume'weighted buying pressure; a classic Wyckoff 'accumulation' signal. | | RSI | 55 | Mid'range, no overbought concern yet. | | VWAP | ''7.86'% | Price is above VWAP, confirming bullish bias. | | Week'to'Date | +2.09'% | Moderate momentum. | | Month'to'Date | +14.75'% | Strong monthly trend. | | Year'to'Date | '3.60'% | Slight pullback but not trend'reversing. | | Consecutive Counts (SOL) | Price +1, OBV +1 | Sustained buying; indicates potential for a breakout. | | Cumulative Counts (SOL) | Price +2.989'%, OBV +2.6379'% | Long'term bullish accumulation. |
Wyckoff Stage Identification
- Accumulation Phase (Stage B)
- Price climbs while OBV rises markedly.
- VWAP is lower than price, supporting a bullish bias.
-
Market cap remains bullish with cumulative gains, confirming that institutional inflow is sustaining the rally.
-
Distribution Phase (Stage C) ' Potential Soon
- If price starts to consolidate or form a plateau at $190'$195, we would expect volume to tighten, possibly signaling the onset of a distribution phase.
- A breakout above this plateau with continued OBV lift would confirm a bullish breakout.
Game'Theory Dominant Strategy
- Players: Institutional/whale investors (buying) vs. retail traders (following the trend).
- Dominant Strategy: The institutional block is accumulating; retail traders will likely follow once the price breaks a resistance level.
- Optimal Play: Enter long at the breakout point with tight stop'loss below $185, capturing the next 10'15'% move before any significant reversal.
Entry & Exit Blueprint
| Trade Type | Entry | Target | Stop | Rationale | |------------|-------|--------|------|-----------| | Intraday Scalping | $188.50 (first break of $188) | $195.00 (''+4'%) | $186.50 (1'% below entry) | OBV surge + VWAP above price; high liquidity. | | Day Trade | $186.00 (support near $185.80) | $192.00 (+3.2'%) | $184.00 | Sustained upward momentum, price above 50'day MA (assumed). | | Swing (Short'Term) | $186.90 (current) | $200.00 (+6.6'%) | $184.90 | Projected continuation of the month'to'date +14.75'% trend. |
Risk Management
- Use a 1'2'% risk per trade.
- Trail the stop to lock in profits after the first 5'% move.
- Monitor daily volume spikes; if OBV turns down sharply, consider exiting early.
Confidence Assessment
- Score: 85'% (High Confidence)
- Classification: BUY ' INTRADAY
The combination of bullish market cap momentum, strong OBV growth, and SOL's rising trend provides a clear directional bias. The dominant strategy in this market context is to go long, particularly on intraday opportunities where price is breaking new levels.
Call to Action
The current confluence of macro'level inflows and micro'level accumulation on SOL creates a prime window for profitable trading. Don't let this momentum pass you by. Join Auctron today to receive real'time alerts, advanced Wyckoff'based analysis, and personalized trade recommendations that keep you ahead of the curve. Act now'markets wait for no one.
#SOLPowerUp #SOLBullRun