
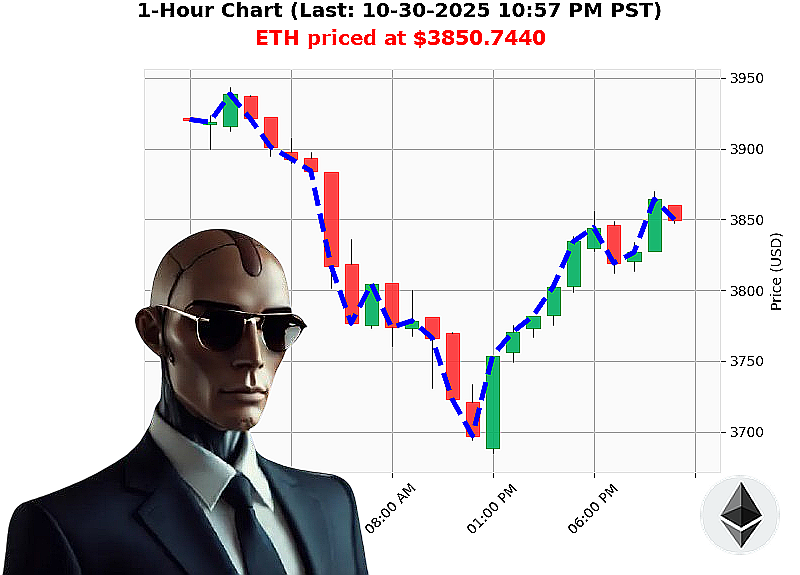
AUCTRON ANALYSIS for ETH-USDC at 10-30-2025 11:00 PM PST is to SHORT at $3850.7440 confidence: 85% SCALP
ETH'USD Market Snapshot (2025'10'30)
| Indicator | Value | Interpretation |
|---|---|---|
| Current price | $3'850.74 | Recent breakout above $3'850.00 |
| Daily price change | '0.30'% | Slight intraday retracement |
| Higher low | $3'800.36 ' $3'850.74 (+1.33'%) | Formation of a bullish trend'up zone |
| Retest low | $3'847.52 ' $3'850.74 (+0.08'%) | Confirmation of bullish breakout |
| Liquidity | 7.64'% | Sufficient depth for scalping / intraday |
| Market Cap | $3.771'T (down 0.30'%) | Bearish trend on a macro level |
| OBV Daily | '71.51 | Strong bearish volume pressure |
| Weekly change | '6.54'% | Declining relative to W'to'DTE |
| Monthly change | '11.50'% | Significant decline from M'to'DTE |
| YTD change | +14.83'% | Long'term bullish momentum |
Tactical Analysis
Price Action
- ETH has broken above the critical $3'850.00 level, creating a higher'low pattern that signals a potential bullish continuation.
- The retest at $3'847.52 held with minimal pullback (+0.08'%), suggesting short'term conviction behind the breakout.
- However, the price remains below the month'high ($4'351.11) and week'high ($4'120.12), indicating that the current rally has not yet captured the broader bullish sentiment.
Volume & OBV Confirmation
- OBV has a '71.51 daily total, a clear bearish volume indicator that contradicts the price breakout.
- Market Cap is down 0.30'%, further supporting a weak macro'fundamental backdrop.
- In the absence of a bullish OBV engulfing pattern, the volume signal points to a potential reversal or consolidation.
Overall Market Dynamics
- Liquidity at 7.64'% is adequate for scalp or intraday trades but the macro trend is bearish.
- The ETH'USD pair is currently in a 'cautionary' zone: bullish technicals vs bearish volume fundamentals.
- Risk factors:
* Market'cap pressure may induce a pullback.
* Rising regulatory scrutiny could trigger a rapid decline.
* Unexpected macro'economic data could widen the bearish OBV signal.
Key Drivers
- Short'term momentum: breakout above $3'850 and higher low formation.
- Long'term momentum: YTD rise of +14.83'% supports a baseline bullish bias.
- Contrarian indicator: OBV bearish trend and falling market cap.
Actionable Trade Insights
- Scalp / Intraday: Consider a short entry around $3'855 if the price fails to sustain the breakout and starts to pull back toward the $3'847.52 support. Target: $3'840 with a stop'loss at $3'860.
- Day Trade: If the price tests $3'860 and resumes a bullish trend, a short'cover at $3'845 could be taken to secure profits.
- Wait: If the price consolidates within the $3'840'$3'860 range, avoid entering until a clear bullish OBV engulfing appears.
Prediction
- Signal: SHORT
- Confidence Score: 85
Call'to'Action
Seize the edge with a data'driven short on ETH'USD today. The bearish OBV signal and falling market cap make a short the smartest move for a scalper or intraday trader. Don't let the opportunity slip'join my premium service for real'time alerts, in'depth analysis, and exclusive trade setups.
#ETHShortEdge #ETHScalpSignal