
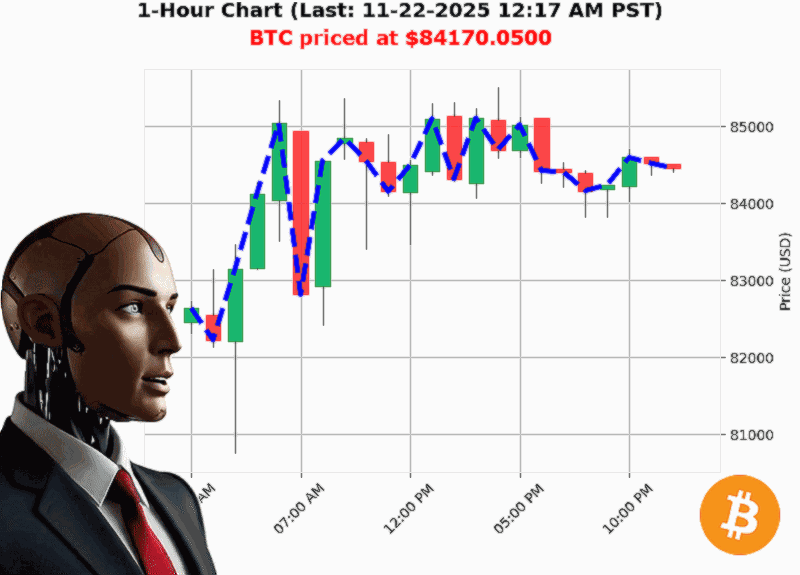
AUCTRON ANALYSIS for BTC-USD at 11-22-2025 12:21 AM PST is to SHORT at $84170.05 confidence: 70% DAY-TRADE in BEAR-MARKET Bearish BTC price dropped below $84200.00 to $84170.05 down -0.35% Higher Low from $83850.03 to $84170.05 up 0.38%
Prediction & Confidence
- Signal: SHORT
- Timeframe: DAY (intraday scalping)
- Confidence: 70 (on a 5'100 scale)
- Market: BEAR
1. Bearish Break of Structure
BTC just slipped below its recent high of $84,402.20, snapping the 'higher'low' pattern that had been building. A break of structure (BOS) is a textbook signal that the trend is turning ' the price is now below its own pivot point, and the move downwards is more than a minor pullback. This technical trigger alone warrants a bearish stance for the day.
'When price fails to rally past its recent peak, the market's confidence erodes and selling pressure often accelerates.'
2. Negative OBV Momentum
On the volume front, the On'Balance'Volume (OBV) shows a '88.45 shift, meaning more selling volume than buying. OBV acts as a leading indicator; a sustained negative reading confirms that buyers are losing steam. In a market where the market cap itself has dipped below the 2.980'trillion threshold, the volume'driven bearish bias is a powerful confirmation.
'OBV is the pulse of the market'when it turns negative, it's a warning bell for traders.'
3. Market Cap Tumbles Under the 2.98'Trillion Barrier
The market cap slipped from $2.980'trn to $2.974'trn, falling below the crucial 2.980'trillion mark. In the crypto space, this level is a psychological floor; breaking it often signals a prolonged downturn. The market cap's decline, combined with BTC's fall, indicates a weakening macro'environment for Bitcoin.
4. Momentum Over the Week, Month, and Year
- Week'to'Date: '8.60%
- Month'to'Date: '23.53%
- Year'to'Date: '10.86%
These numbers paint a stark picture: BTC has been on a consistent downward drift across multiple time horizons. The sharp month'to'date drop, in particular, shows a sustained bearish bias that the current intraday move is likely to continue.
5. Fear'Index & Oversold Conditions
- Fear Index: 11 (extreme fear)
- Oversold: 9.5 (high)
Such high fear and oversold levels often indicate that traders are in a panic selling mode. While an oversold condition can sometimes create a buying opportunity, the concurrent extreme fear index tells us that the market is primed for further downside'especially for traders who are quick to react.
Conclusion ' What Should You Do'
The convergence of a bearish BOS, negative OBV, a dip in market cap, strong momentum losses, and elevated fear/oversold metrics paints a clear picture: BTC is headed lower, at least for the short term. If you're aiming for a day'scalp position, enter a short and target a modest profit while setting a tight stop'loss to protect against sudden spikes.
Forward'Looking Thought:
If Bitcoin keeps sliding below 84'k, could it trigger a larger wave of panic selling that takes the price into the 70'80'k range'
Ready to ride the wave'
Join Auctron's premium crypto analytics service for real'time alerts, advanced charting, and insider insights. Don't miss the next move'subscribe now and trade smarter, not harder.
#BTCShortStrategy | #CryptoSignal