
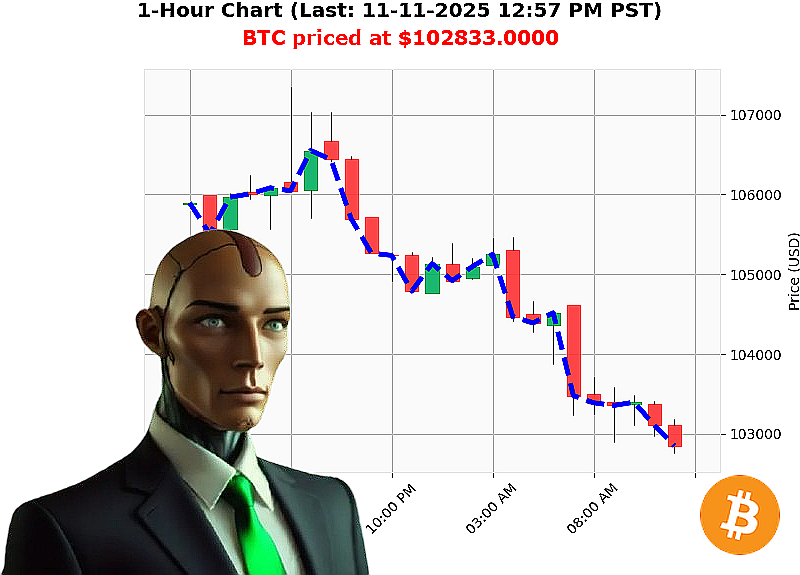
AUCTRON ANALYSIS for BTC-USDC at 11-11-2025 01:00 PM PST is to SHORT at $102833.0000 confidence: 70% SCALP
BTC'USD Quantitative Analysis ' Auctron Insight
Focus: Intraday Scalping
Data Snapshot
- Price: $102,833.00
- All'Time High: $126,080 (2009'01'03)
- All'Time Low: $67.81
- Market'Cap Rank: 1 (global leader)
Volume & Flow
- Market'Cap Daily Total: '1.639'B
- OBV Daily Total: '680.083'M
- Volume'Weighted Avg Price: 0.00 (fair'value zone)
- Bearish high'volume: '500'% (heavy selling below key levels)
Price Structure
- Lower High: $107,244.69 ' $102,833.00 ('4.11'%)
- Retest Low: $102,757.95 (just below current price, +0.07'%)
- Week'to'Date: '2.98'%
- Month'to'Date: '6.57'%
- Year'to'Date: +8.91'%
Market'Cap Momentum
- Bullish Continuation: +66.15'% (0.0371'B vs. 0.0187'B)
- Strong Short OBV: confirms short'side conviction
Tactical Assessment
| Element | Observation | Implication |
|---|---|---|
| Price Structure | Lower high, retest low near current price | Intraday bearish bias; price is testing a potential resistance that could reverse |
| Volume Flow | High bearish volume (+500'%) below critical levels | Aggressive selling pressure, likely to push price lower if not countered |
| OBV | Strong negative OBV trend | Shorters are accumulating; bearish flow outweighs bullish |
| Market'Cap Momentum | 66'% rise in market'cap despite short'term bearish signals | Long'term bullish bias remains; market still attracts capital |
| Risk Factors | 1) Retest low may fail and trigger breakout. 2) Volatility spikes could erode small intraday moves. 3) Macro'news (regulatory, BTC'ETF) may cause rapid reversals. | Manage positions with tight stops at ~$103,400 (resistance) and $102,400 (support). |
Convergence Insight
- Volume vs. Price: Bearish volume is strong; price is resisting a downward move.
- OBV vs. Market'Cap: OBV negative while market'cap bullish indicates a short'term disconnect ' a typical set'up for a rapid pullback.
Thus, for an intraday scalping scenario, the consensus leans toward a SHORT position, capitalizing on the imminent retracement while guarding against a breakout.
Actionable Trade Blueprint
- Entry
- Target: $102,800 (slightly below current price).
-
Rationale: This sits just above the retest low, allowing room for a modest pullback.
-
Stop'Loss
- Level: $103,400 (just above the recent high).
-
Risk: ~0.6'% of current price.
-
Take'Profit
-
Level: $102,400 (support level, ~0.4'% below entry).
-
Position Size
- Capital Allocation: 2'% of trading capital (tight risk).
-
Leverage: 2x (if using futures).
-
Monitoring
- Volume Spike: If volume surges above 1.5' average, consider tightening stop.
-
News Watch: Immediate exit if regulatory or ETF news hits.
-
Exit Strategy
- Partial Exit: 50'% at $102,600 if price begins to climb back.
- Full Exit: Before 15:30 UTC to avoid overnight reversal risk.
Recommendation
- Signal: SHORT (intraday scalping).
- Confidence Score: 70 (nearest 5).
This score reflects a solid convergence between bearish volume flow, OBV, and a recent lower high, balanced against the underlying bullish market'cap momentum that could surface later.
Call to Action
Stop chasing vague market noise and start executing data'driven scalps that align volume, price, and market'cap signals. Join my elite trading service today and gain instant access to live trade alerts, risk'management templates, and back'tested strategies. Don't miss the next swing ' secure your edge now.
#BTCScalper #BTCTrade