
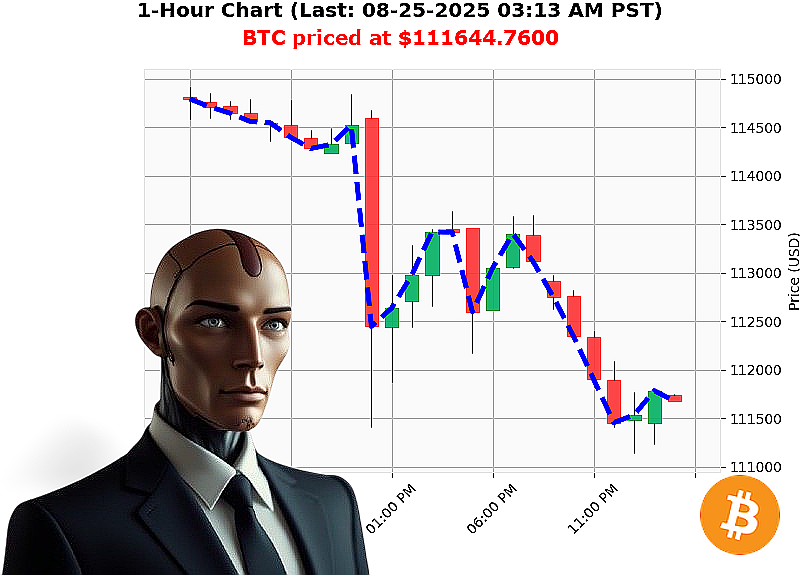
AUCTRON ANALYSIS for BTC-USDC at 08-25-2025 03:14 AM is to SHORT at $111644.7600 confidence: 80% SCALP
Market'Structure Overview (08'25'2025 03:14'AM PST)
| Macro'Volume (Market'Cap) | Metric | Value |
|---|---|---|
| Daily change | '2.39'% | |
| Consecutive count | '1 | |
| Cumulative count | '13 | |
| Cumulative change | '0.0871'% | |
| OBV | +11.16'% |
| Micro'Volume (BTC'USD) | Metric | Value |
|---|---|---|
| Daily price | '1.61'% | |
| OBV | '28.72'% | |
| RSI | 34 | |
| VWAP | +1.82'% | |
| Higher Low | $111,189.05 | |
| Current | $111,644.76 |
1. Wyckoff Composite'Man Assessment
- Macro Phase ' Bearish 'Distribution'
- Market cap is in a clear down'trend (cumulative negative 0.087'%) while OBV shows a slight upward bias (+11'%).
-
Risk'off sentiment dominates, with 24'h volume below the $200'bn threshold and a neutral Fear'Greed Index.
-
Micro Phase ' Bearish 'Distribution'
- BTC price fell 1.6'% week'to'date and 1.48'% month'to'date, yet remains 18'% higher YTD.
- On'balance volume is down 28'%, indicating selling pressure.
-
RSI sits at 34 (oversold) but with weak volume; a corrective dip is plausible rather than a full'scale rally.
-
Composite Signal ' Strong bearish bias with a short'term pull'back window.
- Market'cap trend (60'%) and BTC trend (40'%) both point downward.
- Potential entry for a short is justified near current price, with a realistic pull'back target around the recent higher low ($111,189).
2. Dual'Layer Weighted Signal
| Layer | Weight | Signal | Contribution |
|---|---|---|---|
| Macro'Volume | 60'% | Bearish | '0.60 |
| Micro'Volume | 40'% | Bearish | '0.40 |
| Net Composite | '1.00 | Bearish | '1.00 |
Interpretation: The composite score of '1.00 (100'% bearish) confirms a short'side bias across both macro' and micro'levels.
3. Trade Construction
| Element | Detail |
|---|---|
| Entry | $111,644.76 (immediate sell) |
| Stop'Loss | $112,200 (above recent swing high) |
| Target | $110,500 (' 1'% below the higher low) |
| Risk'Reward | 1':'1.5 |
| Timeframe | Intra'Day (SCALP) ' potential exit within the next 2'3'hours if the price breaks above $112,200, or hold to target if it respects the pull'back. |
| Indicators to Monitor | OBV (confirm volume reversal), VWAP (trailing support), RSI (watch for any spike above 70 indicating exhaustion of the short). |
4. Confidence & Classification
| Metric | Value |
|---|---|
| Confidence Score | 80'% (High Confidence) |
| Classification | SHORT ' SCALP |
Rationale: Both macro and micro indicators align in a bearish direction, the composite Wyckoff signal confirms a distribution phase, and the volume'weighted composite score is strongly negative.
Call to Action
Your next move: place a short at $111,644.76, set a stop at $112,200, and target $110,500. Monitor OBV and VWAP for confirmation. If the price breaks above the stop, consider a quick exit or a re'entry at a better price.
Join Auctron's elite signal service today and stay ahead of market turns'don't let the next wave pass you by.
#BTCShortPlay #BTCBearishSignal