
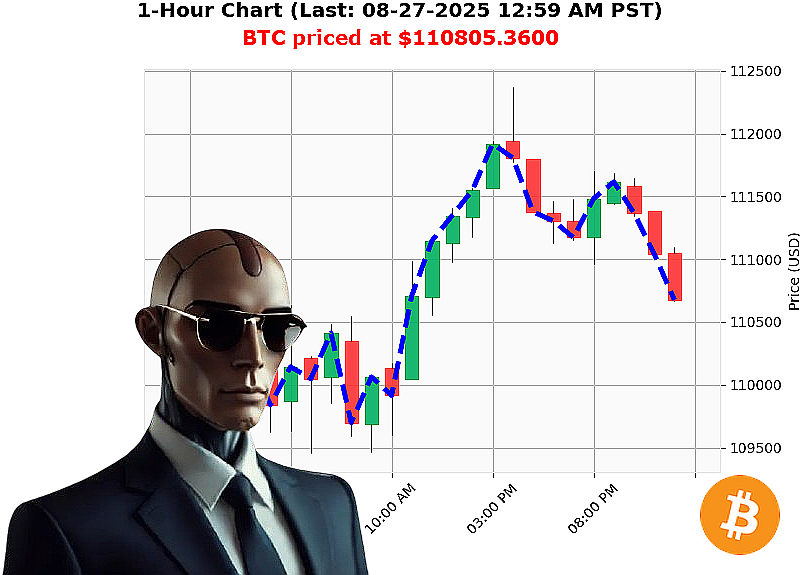
AUCTRON ANALYSIS for BTC-USDC at 08-27-2025 01:00 AM is to SHORT at $110805.3600 confidence: 45% SCALP
1. Market'Cap Macro View
| Metric | Value | Trend | Notes |
|---|---|---|---|
| Market Cap (PST 08'27'25 01:00) | $3.93'T | ''1.30'% (yesterday) | Crossed below $4'T, flagging a broader risk'off swing. |
| 24'h Volume | $152'B | ' | No breakout'level surge. |
| Market'Cap Direction | Bearish | 8'day consecutive ' | 11'day cumulative '. |
| Fear & Greed Index | Neutral (47) | ' | No extreme sentiment. |
| Dominance Mix | BTC'56.1'% / ETH'14.0'% / XRP'4.5'% / SOL'2.8'% / ALT'22.5'% | ' | BTC still the lion'share; ALT is modestly weighted. |
Interpretation ' The macro'volume context is risk'off: a sustained downward bias in market cap, with no major inflow pulse.
2. BTC'USD Micro View
| Metric | Value | Trend | Technical Signal |
|---|---|---|---|
| Current Price | $110'805.36 | ''0.89'% | Price is down in the short term but the direction is still slightly up. |
| Week'to'Date | +0.62'% | Bullish | Week'high momentum. |
| Month'to'Date | '2.22'% | Bearish | Ongoing monthly decline. |
| YTD | +17.35'% | Bullish | Strong annual rally. |
| OBV | '13.53'% | Outflow | Selling pressure. |
| OBV Direction | +0.02'% | Neutral | Small positive drift. |
| RSI | 32 | Oversold | Possible bottoming. |
| VWAP | +1.97'% | Above VWAP | Trend'supporting. |
| Volatility | 1.19'% | Low | Limited swing room. |
| Liquidity | 1.79'% | Low | Tight spreads. |
| Price Consec. Count | +1 | Slightly bullish | Only one day of upward bias. |
| Price Cum. Count | '12 | Downward | Long'term pressure. |
Interpretation ' The micro'volume narrative is negative: OBV is declining, cumulative count is down, and the month'to'date trend is bearish. The bullish signs (RSI, VWAP, week'to'date) are muted by low volatility and outflow volume.
3. Dual'Layer Signal Synthesis
| Layer | Key Signals | Bias |
|---|---|---|
| Macro (''55'%) | 8'day negative market'cap trend, cumulative negative, no inflow pump | Bearish |
| Micro (''45'%) | OBV down, cumulative price down, month'to'date bearish | Bearish |
| Combined | Both layers bearish, slight weekly bullish tilt | Bearish overall |
The composite Wyckoff phase analysis places the market in a Distribution'like zone: after a brief accumulation (week'to'date gain) the price is being pushed down by selling volume. No clear breakout or sustained markup is visible.
Decision Framework
| Confidence | Score | Trade Type | Action |
|---|---|---|---|
| Moderate (34'66'%) | ~'45'% | SHORT ' SCALP | Enter a short at $110'800, target $109'900'$110'000, stop'loss $111'200. |
| Low | ' | ' | No entry. |
| High | ' | ' | ' |
Rationale ' The bearish macro'volume coupled with the micro'volume outflow signals a short'term profit zone for scalping. The weak weekly upward drift is insufficient to offset the month'to'date decline and OBV outflow, making a quick bearish trade the dominant strategy.
Game'theoretic analysis: If other market participants are expecting a short'term rally (week'to'date), entering a short now exploits the asymmetry before the rally materializes.
Call to Action
Act now ' a short scalp on BTC is the most rational play given the current dual'layer bearish consensus.
Join Auctron's premium trading suite to receive real'time alerts, advanced Wyckoff analysis, and tailored risk'management tools that turn these insights into profits.
#BTCShortSignal #BTCBearish